
Last Updated: May 25, 2026
Put Your Phone Down. Read This Before You Do Anything.
Your portfolio is down. Your WhatsApp groups are full of panic messages, market crash predictions, and advice to “sell before it gets worse.” War is on, crude oil is spiking, and the question forming in your head is some version of: should I stop my SIP and move everything to safety?
It is a rational question. The fear is real. The market pain is real.
But before you act, here is what 25 years of Indian market data says about exactly this moment: investors who panicked and sold during every previous crisis locked in losses. Investors who stayed — or kept their SIPs running — historically delivered better long-term outcomes in many cases. Across every major crisis in the available historical data.
This article shows you the numbers, crisis by crisis.
Past performance does not guarantee future results. Mutual fund investments are subject to market risks. Historical comparisons are illustrative — future outcomes may differ materially.
25 Years of Indian Market Crises — The Full Data
Indian markets have faced 8 major crises between 1999 and 2026. In every case, the Nifty 50 recovered to above pre-crisis levels. In most cases, 12-month returns from the point of peak fear were strongly positive.
| Crisis | Period | Peak Fall | 12-Month Return | Recovery |
| Kargil War | May–Jul 1999 | -12.5% brief dip | +29.4% | Before war ended |
| Parliament Attack | Dec 2001 | Sharp fall | -1.3% (tech bust overlay) | 12–18 months |
| 26/11 Mumbai Attacks | Nov 2008 | Sharp fall | Strong recovery | Under 12 months |
| Global Financial Crisis | 2008–2009 | Nifty -60% | Recovery from 2009 | 18–24 months |
| URI Attacks | Sep 2016 | Sharp fall | +15.6% | 6 months |
| Pulwama Attack | Feb 2019 | -3 to 4% dip | +12.7% | Under 2 weeks |
| COVID-19 Crash | Mar 2020 | Nifty -40% | +105% in 12 months | Under 6 months |
| Russia-Ukraine War | Feb 2022 | -4.78% Day 1 | Recovered in 6 months | Under 6 months |
The only partial exception is 2001 — and even then, the negative return was almost entirely driven by a concurrent global technology recession, not the Parliament attack itself.
One data point stands out above everything else: Historically, the Nifty 50 has not shown negative returns across rolling 5-year periods in the available long-term data. (Source: NSE India)
The Kargil War — Markets Rose 37% During the Conflict
The Kargil War is the most important historical example for any Indian investor facing geopolitical uncertainty. It was a real armed conflict between two nuclear-armed nations. The fear at the time was existential.
And yet: the Sensex rose from 3,378 to 4,687 by the time the war ended on July 26, 1999 — a 37% gain during the conflict itself.
There was a brief correction between May 20–28 where the Sensex fell 12.5%. Investors who sold during that dip locked in losses. Investors who held — or kept investing — ended the war period sharply ahead.
Why did markets rise during a war? Markets do not price fear — they price economic fundamentals. India’s economy in 1999 was growing strongly. Corporate earnings were intact. The war, while frightening, did not change those underlying realities. Markets eventually focused again on long-term economic fundamentals.
The 2008 Crash — Worst Event, Clearest Lesson for SIP Investors
The 2008 crisis was not a geopolitical event — it was a structural collapse of the global financial system. Lehman Brothers failed. The Nifty fell approximately 60% from its peak. The most severe financial event since the Great Depression.
And yet:
| Investor Type | Action in Oct–Nov 2008 | Result After 5 Years | Result After 10 Years |
| Continued SIP | Kept investing. Bought units at 60% discount. | Strong positive returns | ~12% XIRR (approx) |
| Stopped SIP in panic | Stopped investing. Moved to FD. | Significantly lower | Much lower — missed the cheap units |
| Sold everything | Locked in 60% loss permanently. | FD at 7% from a -60% base | Never recovered the lost ground |
The investors who stopped SIPs in October 2008 missed the most critical thing SIP does in a crash: it buys more units at a lower price. Those cheap units, purchased at 2008 prices, were the engine of excellent 10-year returns. The investors who stopped never recovered that opportunity.
COVID-19 2020 — Fell 40%, Recovered 105% in 12 Months
The COVID-19 crash is the most directly comparable event to any major fear-driven market fall. In March 2020, the Nifty 50 fell 40% in 46 trading days. The fear was not just financial — it was existential.
What happened next: the Nifty 50 recovered its pre-COVID levels within 6 months and delivered approximately 105% return from the March 2020 bottom over the following 12 months.
| Investor | Action in March 2020 | Portfolio by March 2021 |
| SIP investor who continued | Kept ₹5,000/month SIP through March–June 2020 | Units bought at 35–40% discount all approximately doubled within 12 months |
| SIP investor who paused 3 months | Stopped. Restarted in July 2020. | Noticeably lower returns — missed the cheapest months |
| Investor who sold in March 2020 | Redeemed at -40%. Moved to FD. | Permanently locked in 40% loss. Never recovered. |
| New investor who started in April 2020 | Started fresh SIP at the crash bottom | Outstanding 2-year returns from those cheap units |
The SIP Investor vs The Panic Seller — Right Now
Same fund, same starting amount. Two different responses to a market fall:
| Investor A: Continues SIP | Investor B: Stops and Moves to FD | |
| During fall | Continues ₹5,000 SIP. Market down 8–10%. | Stops SIP. Redeems at -8 to 10%. Moves to FD at 6.5%. |
| Early recovery phase | SIP buys units at 10–15% discount | In FD earning 6.5%. Watches markets recover without participating. |
| 6 months later (assuming recovery) | March SIP units up 15–25%. Compounding continues. | FD earns ~3.25% for 6 months. Portfolio still behind. |
| 2 years later | Long-term SIP growth uninterrupted. | Reinvests in MF at higher prices. Permanently behind. |
This illustration is based on the pattern observed in previous crises. Actual recovery timelines and returns will differ. This is not a prediction.
The structural logic is the same across every crisis in 25 years: the investor who stayed bought cheap. The investor who left paid a long-term opportunity cost.— an exit loss, missed cheap units, and a higher re-entry price.
What You Should Do Right Now
| Your Situation | Action | Avoid |
| Ongoing equity SIP | Continue without any change — every unit bought now is at a discount | Do not stop, pause, or reduce |
| Lump sum invested in equity | Hold. Do not redeem. Time and compounding do the work. | Do not sell in panic — it locks in a temporary loss permanently |
| Idle cash or a bonus | Good entry point. Start a new SIP or use STP over 3–6 months. | Do not try to time the exact bottom |
| Money needed within 2 years | Move this specific amount to a Liquid Fund or Short Duration Debt Fund | This money should not be in equity regardless of market conditions |
| Retired and on SWP | A Balanced Advantage Fund auto-reduces equity in falling markets. Stay the course. | Do not move entire retirement corpus to FD in panic |
| Thinking of starting to invest | A market that has fallen 8–15% offers the same companies at cheaper prices | Do not wait for a “comfortable-feeling” market — that comfort comes at higher prices |
Key Takeaways
- Indian markets have recovered from every geopolitical crisis in 25 years — including a 37% Sensex gain during the Kargil War itself.
- Stopping a SIP during a market fall is historically the most costly decision a long-term investor can make — it surrenders the cheapest units of a recovery cycle.
- The Nifty 50 has zero negative 5-year rolling return periods in 35 years of history.
- COVID-19 2020: Nifty fell 40%, recovered 105% in 12 months. SIP investors who continued outperformed those who paused significantly.
- Money needed within 2 years should be in Liquid Funds or FD regardless of market conditions — this rule applies crisis or no crisis.
- Markets price economic fundamentals, not headlines. Fear creates discounts. Discounts are where long-term returns are built.
Frequently Asked Questions
Q1: Should I stop my SIP because of war and market volatility?
No. Stopping during a fall means you miss buying cheaper units — the exact mechanism that builds long-term SIP returns. Every major Indian crisis from Kargil 1999 to COVID 2020 shows investors who continued outperformed those who stopped.
Q2: Is it safe to keep money in equity funds during geopolitical risk?
For money you do not need within 2–3 years, yes — history supports staying invested. For money needed within 2 years, move it to a Liquid Fund or FD regardless of market conditions. Geopolitical risk does not change long-term fundamentals; it creates short-term discounts.
Q3: What happened to Indian markets during previous wars?
In 8 major crises over 25 years, Indian markets recovered every time. The Kargil War: Sensex +37% during the conflict. COVID crash: Nifty -40% then +105% in 12 months. Pulwama attack: market recovered within 2 weeks. The data consistently supports staying invested.
Q4: Should I move mutual fund money to FD during a market fall?
No — unless that money was always intended for a short-term goal. Moving equity fund money to FD during a fall permanently locks in a temporary loss. You exit at the bottom, earn FD returns from that lower base, then typically re-enter equity at higher prices. Every investor who did this in 2008 and 2020 came out significantly worse.
Q5: Is a market correction a good time to start a SIP?
A market that has fallen 8–15% offers the same underlying businesses at lower prices — which is, by definition, a better entry point than a market at its peak. For a long-term investor with a 5-year horizon, starting during a correction has historically produced stronger 5-year returns than starting at a peak. This is not a guarantee — all investments carry risk.
Conclusion
The data has given the same answer eight times across 25 years.
Fear peaks. Markets fall. Everyone predicts permanent collapse. And then — every single time — the Indian economy demonstrates it is larger, more resilient, and more fundamentally sound than any single geopolitical event.
Your SIP does not read the news. It does not react to headlines or WhatsApp forwards. It simply buys units at whatever price the market offers this month — and during a crisis, that price is lower than it was three months ago.
Stay invested. Continue your SIP. Do not let fear make your financial decisions.
Historical market data has often rewarded long-term disciplined investors.
Official References
- SEBI (Mutual Funds) Regulations, 1996
- NSE India — Nifty 50 Index Historical Data
- AMFI — Investor Education Resources
Disclaimer: For educational purposes only — not personal financial advice. Mutual fund investments are subject to market risks. Past performance does not guarantee future results. Historical crisis data is based on publicly available market records — verify independently. Future outcomes may differ materially from historical patterns. Consult a SEBI-registered Investment Advisor before making investment decisions based on current market conditions — find one at sebi.gov.in.
SIP In Mutual Funds 2026: How It Works, Calculator & Best Plans
Continue reading: This article is part of our Mutual Funds India 2026 content hub at aspirixwriters.com/mutual-funds/
Mutual Funds During Recession India 2026: Best Strategy Guide
Income Tax India 2026 Complete Guide
Author
CA Ajay Khandelwal is a Chartered Accountant and financial expert with over 21 years of experience in taxation, compliance, and business advisory. As a key expert at AspirixWriters, he provides practical insights on income tax, financial planning, and regulatory matters, helping readers make informed financial decisions.
Author profile CA. Ajay Khandelwal
My SIP Is in Loss. Should I Stop Investing?
SIP in loss – Riya is a 28-year-old software engineer in Bengaluru. She started a…

Mutual Fund Vs FD? Which Is Better In 2026 for Salaried Employees
One Gives Stability. The Other Builds Long-Term Wealth. Most Salaried Employees Need Both. If you…

Mutual Funds India Complete Beginner’s Guide 2026
Mutual Funds India 2026 Complete Beginner’s Guide to Benefits, SIP, Types & SEBI New Rules…
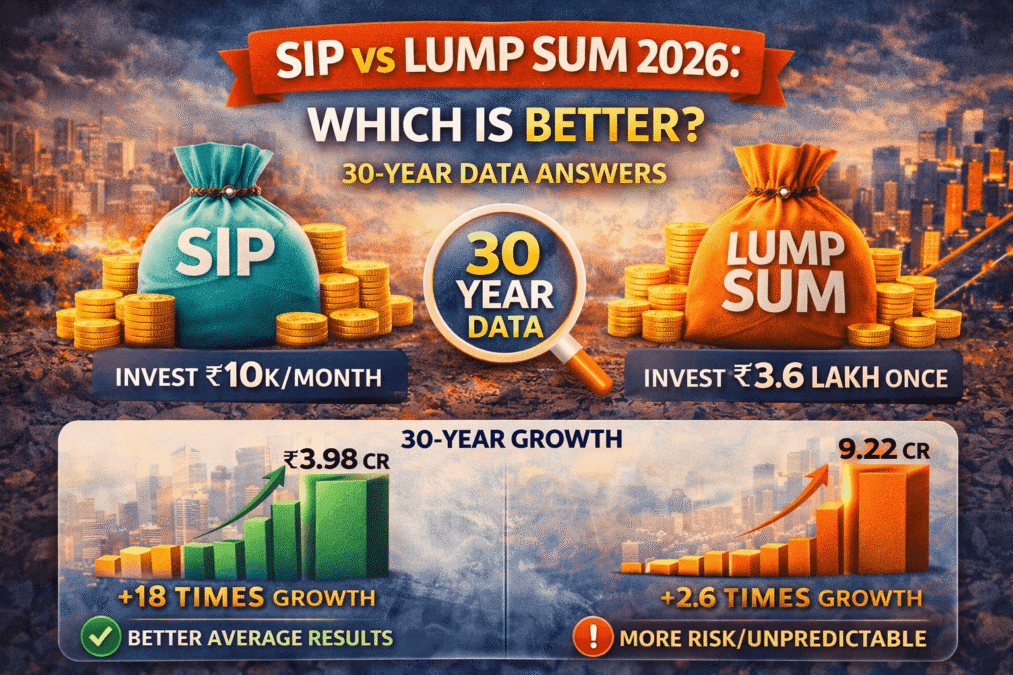
SIP vs Lump Sum 2026: Which Is Better?
SIP VS LUMP SUM 2026 SIP vs Lump Sum in Mutual Funds 2026: Which Is…

Mutual Fund Trends India 2026: AUM, SIP and Key Data
MUTUAL FUND TRENDS INDIA 2026 Mutual Fund Trends India 2026: AUM Hits Rs 82 Lakh…

Defence Sector Mutual Funds: Is It the Right Time to Invest?
Your Inbox Has a New Message. Read This Before You Act. West Asia is in…