Last Updated: April 19, 2026
The Results Section
Module 1: Understanding the Structure of Research Papers and Theses
From Concept to Submission Series | 2026
Academic Writing Mastery: The Complete 2026 Guide To Research Papers, Thesis & Dissertation Writing
← Back to Main Post: The Complete Guide to Research Paper Structure

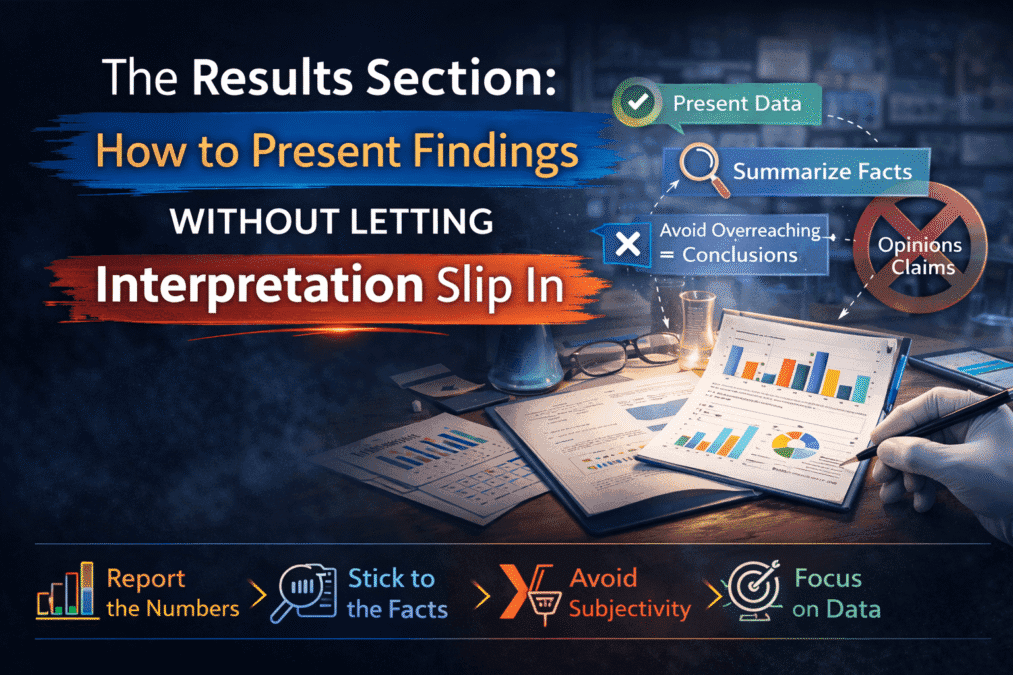
The Results Section: How to Present Findings Without Letting Interpretation Slip In
Your Main post explained the core rule: Results presents facts, Discussion interprets them. This post goes deeper — how to sequence your findings logically, how to report statistics correctly, how qualitative theme presentation works, how to use tables and figures well, and the specific language patterns that let interpretation creep in without you noticing.
Why This Section Is Harder Than It Looks
The Results section looks like the easiest part of a paper to write. You already have the data. You just report it. What is difficult about that?
The difficulty is discipline. You have spent months thinking about what your findings mean. Every instinct you have as a researcher is pushing you toward interpretation — toward explaining, contextualising, connecting. The Results section requires you to suppress that instinct completely and report only what you observed.
This is not arbitrary. It exists because science and scholarship depend on separating observation from interpretation. When you present your data cleanly — without telling readers what to think about it — you give them the ability to evaluate your findings independently, before your interpretation is applied. The moment you mix results with interpretation, you are doing some of their thinking for them. Experienced reviewers notice immediately, and it damages the credibility of everything else in your paper.
How to Sequence Your Results
One thing theMain post does not cover is the order in which findings should appear. There is no single correct sequence, but there is a clear logic that works across most research types.
Start with descriptive statistics or background findings that give context before the main results. Then present your primary findings — the ones that directly answer your research questions or test your hypotheses — in the order your research questions appeared in the Introduction. Finally, present secondary or exploratory findings. This sequence means your most important results are never buried.
For a study with multiple research questions, the cleanest approach is to use your research questions as subheadings within the Results section. This makes it immediately obvious which findings answer which question, and it sets up your Discussion perfectly since the Discussion should follow the same order.
Example structure: Results → 3.1 Sample Characteristics → 3.2 Research Question 1: Does peer mentoring frequency predict retention? → 3.3 Research Question 2: What peer support mechanisms do students describe? → 3.4 Additional Analyses: Subgroup effects by gender and discipline.
Reporting Quantitative Results Correctly
Statistical results need four elements every time: the test statistic, degrees of freedom, p-value, and effect size. Most researchers report the first three and forget the fourth. Effect size is not optional — it tells readers whether a statistically significant finding is also practically meaningful.
Incomplete: “There was a significant difference in retention rates (p = .003).” Complete: “Intervention students showed significantly higher retention rates (82%) than control students (71%), χ²(1, N = 450) = 8.92, p = .003, φ = .14.”
The effect size (φ = .14 in the example above) is small by conventional standards — which is useful information. A finding can be statistically significant and practically trivial. Reporting effect size gives readers what they need to judge which it is.
| Statistical test | What to report |
| t-test | t(df) = value, p = .xxx, Cohen’s d |
| ANOVA | F(df1, df2) = value, p = .xxx, η² or partial η² |
| Chi-square | χ²(df, N = total) = value, p = .xxx, φ or Cramer’s V |
| Pearson correlation | r(df) = value, p = .xxx |
| Multiple regression | β = value, SE = value, t = value, p = .xxx, R² for the model |
Two other things to address in your quantitative results: missing data and outliers. How many data points were missing, and how did you handle them? Did you identify any outliers, and did you include or exclude them? These are not minor housekeeping details — they can affect your findings substantially, and reviewers will ask about them if you do not address them yourself.
Presenting Qualitative Results: Themes, Quotes, and Negative Cases
Qualitative results work differently from quantitative ones. You are not reporting numbers — you are presenting themes or patterns that emerged from your analysis, supported by evidence from your data.
The standard structure for each theme is: name it, define it in one sentence, explain how it manifested in the data, and then support that explanation with one or two direct quotes from participants. The quote is evidence, not decoration. It should illustrate the theme specifically, not just confirm that something was said.
Theme: Peer mentors as institutional navigators. Definition: Students described mentors as guides to processes and resources they would not have found independently. Evidence: Participants consistently described mentors helping them navigate administrative systems rather than just academic content. One student explained: “My mentor showed me how to apply for the fee waiver. I didn’t even know it existed. Without her I would have just dropped out” (P12, Arts). Another described a similar experience with hostel allocation: “He knew who to talk to, which office, what to say. I was completely lost” (P7, Commerce).
Notice what the example does: it defines the theme, describes the pattern across participants (“consistently described”), and uses two quotes from different participants to show breadth rather than one isolated instance. A single compelling quote is not evidence of a theme — it is evidence that one person said something interesting. Themes require pattern.
Negative cases: the part most researchers ignore
Negative cases are data points that do not fit your themes — participants whose experiences contradict the pattern you are describing. Most qualitative researchers quietly ignore them. Strong researchers address them directly.
Acknowledging negative cases does not weaken your analysis. It strengthens it, because it shows you have been rigorous rather than selective. A theme that holds for twenty-two out of thirty participants and is meaningfully different from the eight it does not hold for is a richer, more credible finding than one presented as universal without qualification.
“This theme was evident across most participants but was absent in the accounts of six students who had transferred from private colleges. These students already possessed the institutional knowledge that mentors provided to others, suggesting the navigational function of peer mentoring may be specifically valuable for first-generation or government-school-educated students.”
Using Tables and Figures Without Letting Them Do Your Writing
Tables and figures are tools for communicating data patterns that would take many words to describe in prose. Used well, they make your Results section cleaner and more readable. Used poorly, they create confusion and generate reviewer queries.
Every table and figure must be referenced in your text before it appears. Not after, not in a caption — in the body of the text, before the reader reaches it. This reference should also tell the reader what to notice, not just that the table exists.
Weak: “The results are shown in Table 2.” Strong: “Table 2 shows retention rates across the three colleges. Intervention colleges (A and B) show consistently higher retention than the control college (C), with College B — which used group rather than individual mentoring — showing the highest rate of all (87%).”
The second version is doing real work. It tells the reader what the table shows and which finding within it is most important. This is not interpretation — it is navigation. You are directing the reader’s attention, not telling them what to conclude.
Every table needs a clear descriptive title above it. Every figure needs a caption below it. Columns and axes must be labelled with units. If significance levels are indicated with asterisks, a footnote must explain what each asterisk means. These are not stylistic preferences — they are conditions for the table or figure to be readable.
The Language Patterns That Let Interpretation Slip In
Interpretation rarely enters the Results section as a whole paragraph. It enters word by word, through language that carries evaluative or causal meaning. Learning to spot these patterns in your own writing is one of the most useful editing skills you can develop.
Watch for these specific words and phrases in your Results section and remove or relocate them every time you find them:
- Evaluative adverbs: “surprisingly,” “worryingly,” “encouragingly,” “importantly.” These are your reactions to the data, not the data itself.
- Causal language: “because,” “therefore,” “as a result,” “which caused.” Causation is an interpretation. Results can show association; Discussion explains mechanism.
- Suggestive phrases: “this suggests,” “this indicates,” “this demonstrates,” “this shows that.” All of these belong in Discussion.
- Evaluative adjectives: “high retention,” “strong correlation,” “significant improvement.” Statistical significance is a result. Whether it is “strong” or “high” is a judgment.
Contains interpretation: “Surprisingly, the intervention group showed a high retention rate of 82%, which suggests peer mentoring is effective.” Cleaned: “The intervention group showed a retention rate of 82%.”
The cleaned version is shorter and feels almost too plain. That is exactly right. Plain is the correct register for Results. Save the evaluative language for Discussion, where it belongs and where it will have real effect because it is clearly your interpretation rather than a contamination of your data presentation.
For Law Students & Legal Researchers
Must Read Legal Research Methods: A Complete Guide To Doctrinal, Empirical And Comparative Legal Research (Module 1)
FAQs
Q: What goes in the results section of a research paper?
The results section presents findings objectively without interpretation. For quantitative research: descriptive statistics, inferential test results (test statistic, p-value, effect size), and figures or tables. For qualitative research: themes with supporting participant quotes. The key rule: results reports what was found; discussion explains what it means. Interpretation, comparison with prior literature, and implications belong in the discussion, not the results.
Q: How do you present qualitative findings?
Organise around themes, not individual participants. For each theme: state it clearly; describe it in analytical prose explaining what it represents; provide two or three supporting quotes; note any variation within the theme. The ratio of analysis to quotes should be approximately 60:40. A results section that is mostly quotes with minimal commentary has not done the analytical work that turns data into findings.
Q: What is the difference between results and discussion?
Results reports what you found; Discussion explains what it means. In results, describe patterns, themes, and statistical outcomes without commenting on significance or comparing to other studies. In discussion, interpret findings, explain why they occurred, connect to existing literature, and identify implications. Mixing the two signals unclear thinking. Some journals permit integrated results-and-discussion for qualitative papers, but the intellectual distinction must still be maintained.
Q: How do you report statistical results in a research paper?
Include: test used, test statistic value, degrees of freedom, p-value, and effect size. Example: ‘t(48) = 2.34, p = .023, d = 0.67.’ Effect size is increasingly required — p-values alone do not indicate practical significance. Use APA 7th edition format unless the journal specifies otherwise. Every table and figure must be referenced in the text before it appears and interpretable without reading surrounding text.
Q: Can you discuss findings in the results section?
No. Discussion belongs in the Discussion section. The results section reports objectively what was found. Brief directional statements are acceptable: ‘Group A scored significantly higher than Group B’ is a result. ‘This suggests intervention X is effective’ is a discussion statement and does not belong in results. Peer reviewers consistently flag interpretation in results as a structural error reflecting unclear analytical thinking.
Author
Dr. Rekha Khandelwal, a legal scholar and academic writing expert, is the founder of AspirixWriters. She has extensive experience in guiding students and researchers in writing research papers, theses, and dissertations with clarity and originality. Her work focuses on ethical AI-assisted writing, structured research, and making academic writing simple and effective for learners worldwide.
Author Profile Dr. Rekha Khandelwal | Academic Writer, Legal Technical Writer, AI Expert & Author | AspirixWriters
References
- Braun, V., & Clarke, V. (2006). Using thematic analysis in psychology. Qualitative Research in Psychology, 3(2), 77–101.
- American Psychological Association. (2020). Publication Manual of the APA (7th ed.).
- Field, A. (2024). Discovering Statistics Using IBM SPSS Statistics (6th ed.). Sage.
- Tinto, V. (2012). Leaving College: Rethinking the Causes and Cures of Student Attrition. University of Chicago Press.
- K.S. Puttaswamy v. Union of India, (2017) 10 SCC 1. Supreme Court of India.
Next: The Discussion Section: How to Turn Findings Into Knowledge
← Back to Main Post: The Complete Guide to Research Paper Structure
Next in Series
- Complete Guide : The Academic Writing Process: Complete Guide from First Draft to Submission (2026) (Module 2)
- Complete Guide : Research Methodologies: Complete Guide to Quantitative, Qualitative, Mixed Methods & Legal Research (2026) (Module 3)
- Complete Guide : Data Analysis and Results Presentation: Complete Guide for Quantitative, Qualitative & Legal Research (2026) (Module 4)
- Complete Guide : Organization and Academic Tone: Complete Guide to Professional Scholarly Writing (2026) (Module 5)
- Complete Guide : Peer Review and Publication: Complete Guide from Submission to Acceptance (2026) (Module 6)
- Complete Guide : AI Tools in Academic Research: Opportunities, Ethics, and Best Practices (2026) (Module 7)
- Complete Guide : Grant Writing and Research Funding: Complete Guide to Finding Money for Your Research (2026) (Module 8)
- Complete Guide : Academic Career Development: Complete Guide to Building Your Professional Life in Research (2026) (Module 9)
- Complete Guide : Research Ethics and the IRB Process: Complete Guide to Doing Research Responsibly (2026) (Module 10)

The Complete Guide to Research Paper Structure: IMRAD Format, Thesis Organization & Academic Writing (2026)
From Concept to Submission: A Complete Guide to Research Paper and Thesis Writing Academic Writing…
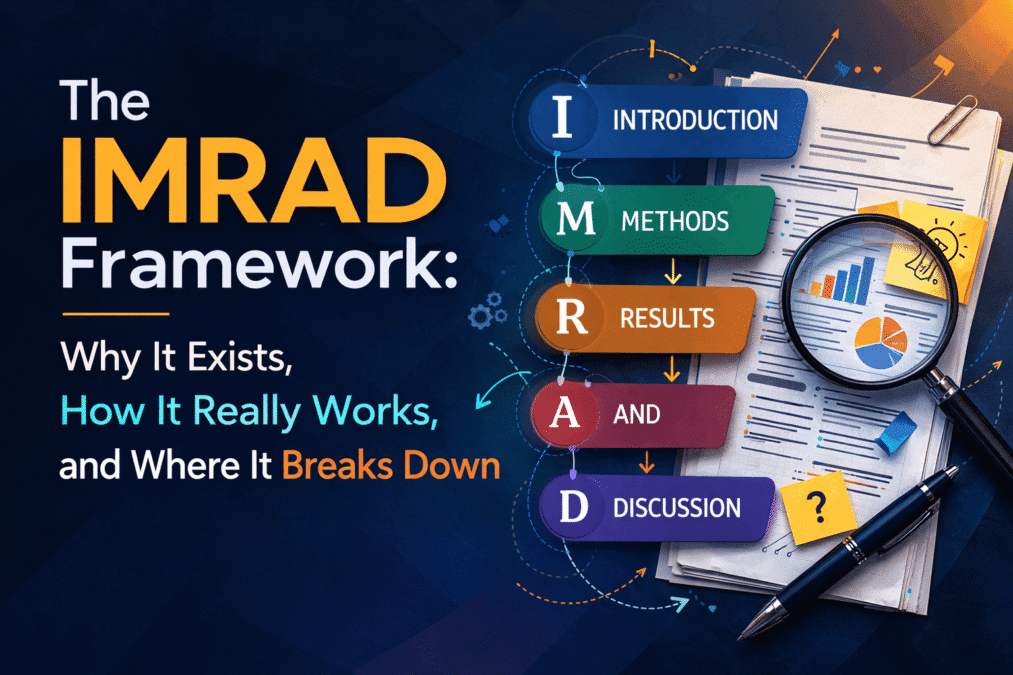
The IMRAD Framework: Why It Exists, How It Really Works, and Where It Breaks Down
The IMRAD Framework Understanding the Structure of Research Papers and Theses – Module 1: From Concept…

How to Write a Research Introduction That Reviewers Cannot Ignore
How to Write a Research Introduction Module 1: Understanding the Structure of Research Papers and…

How to Write a Methods Section That Reviewers Will Trust
How to Write a Methods Section Module 1: Understanding the Structure of Research Papers and…
The Results Section: How to Present Findings Without Letting Interpretation Slip In
The Results Section Module 1: Understanding the Structure of Research Papers and Theses From Concept…

The Discussion Section: How to Turn Findings Into Knowledge
The Discussion Section Module 1: Understanding the Structure of Research Papers and Theses From Concept…