Last Updated: March 26, 2026
(Module 4) Data Analysis and Results Presentation:
From Concept to Submission: A Complete Guide to Research Paper and Thesis Writing
Academic Writing Mastery: The Complete 2026 Guide To Research Papers, Thesis & Dissertation Writing

Why Data Analysis Determines Research Credibility
Here’s what separates published research from rejected manuscripts: appropriate, rigorous data analysis. You can collect perfect data, but analyze it wrong and your conclusions are worthless.
Think about it: Your entire dissertation rests on your analysis. Thesis examiners focus heavily on this section. Journal reviewers with statistical expertise will scrutinize every test, every p-value, every interpretation.
This comprehensive guide teaches you how to analyze and present research findings correctly:
- Quantitative analysis (descriptive and inferential statistics)
- Qualitative analysis (coding, themes, interpretation)
- Mixed methods integration
- Results presentation (tables, figures, narrative)
- Case law analysis (for law students)
- Common analysis mistakes to avoid
Whether you’re running regressions, coding interviews, or analyzing judicial decisions, mastering analysis is essential for research success.
Understanding Your Data First
Before analysis, understand what kind of data you have.
Types of Variables
Categorical (Qualitative):
- Nominal: Categories with no order (gender, discipline, yes/no)
- Ordinal: Ordered categories (education level, Likert scales)
Numerical (Quantitative):
- Interval: Equal intervals, no true zero (temperature in Celsius, IQ scores)
- Ratio: Equal intervals with true zero (age, income, test scores)
Why this matters: Variable type determines which statistical tests you can use.
Quantitative Data Analysis
Step 1: Data Cleaning and Preparation
Before analysis:
Check for errors:
- Impossible values (age = 250, Likert scale response = 7 when scale is 1-5)
- Inconsistent entries (sometimes “male,” sometimes “M”)
- Missing data patterns
Handle missing data:
- Listwise deletion: Remove cases with any missing data (if <5% missing)
- Mean imputation: Replace missing values with mean (if missing at random)
- Multiple imputation: Statistical estimation of missing values (advanced)
Code variables appropriately:
- Assign numbers to categories (Male=1, Female=2)
- Create new variables if needed (combine items into scales)
Create codebook: Document what each variable represents and how it’s coded.
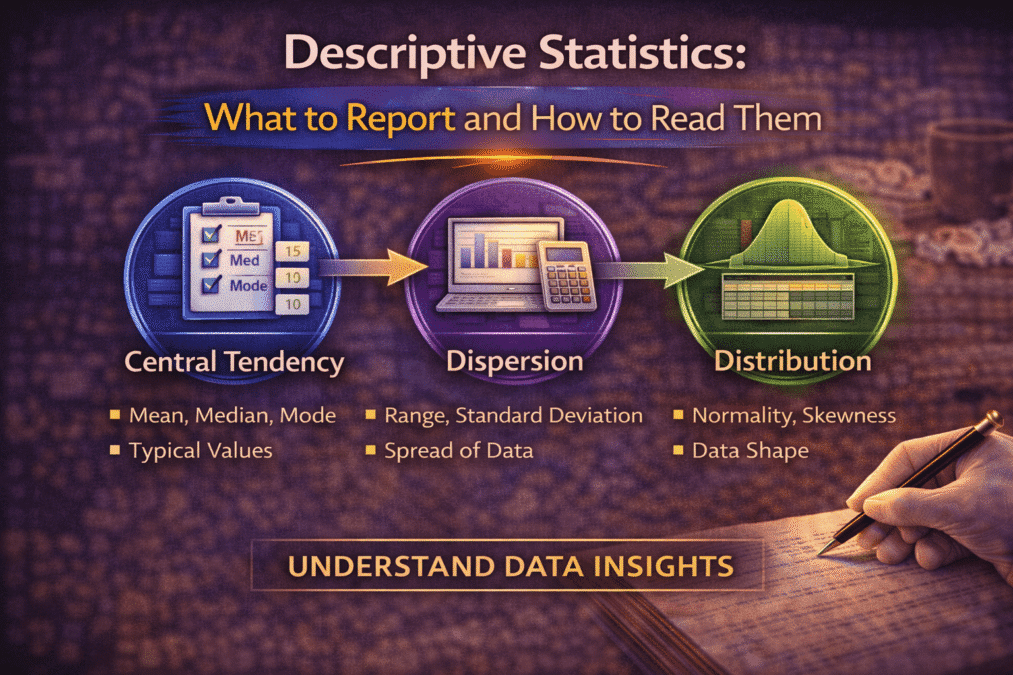
Step 2: Descriptive Statistics
Purpose: Summarize and describe your data.
For numerical variables:
- Mean: Average (use when data is normally distributed)
- Median: Middle value (use when data is skewed)
- Standard Deviation (SD): Spread around mean
- Range: Minimum to maximum
Example reporting:
“Participants’ mean age was 18.3 years (SD=0.8, range=17-21).”
For categorical variables:
- Frequencies: Count in each category
- Percentages: Proportion in each category
Example reporting:
“Of 450 participants, 267 (59.3%) were female and 183 (40.7%) were male.”
Step 3: Inferential Statistics
Purpose: Test hypotheses and draw conclusions beyond your sample.
Common Statistical Tests
Comparing Two Groups:
Independent t-test:
- Compare means between two independent groups
- Example: Do intervention students have higher retention than control students?
Reporting:
“Retention intentions were significantly higher in the intervention group (M=4.2, SD=0.7) compared to controls (M=3.6, SD=0.9), t(448)=7.3, p<.001, d=0.74.”
Key components:
- Means and SDs for both groups
- Test statistic (t value)
- Degrees of freedom (df=448)
- p-value (probability)
- Effect size (Cohen’s d=0.74, medium-large effect)
Paired t-test:
- Compare means for same group at two time points
- Example: Pre-test vs. post-test scores
Comparing Three or More Groups:
One-way ANOVA:
- Compare means across 3+ groups
- Example: Do retention rates differ across Arts, Science, and Commerce students?
Reporting:
“Retention rates differed significantly across disciplines, F(2, 447)=12.4, p<.001, η²=.05. Post-hoc tests showed Science students (M=85%) had higher retention than Arts (M=78%) and Commerce (M=79%).”
Testing Relationships:
Correlation:
- Measure strength and direction of relationship between two variables
- Pearson’s r for linear relationships (-1 to +1)
Example:
“Peer support was positively correlated with retention intentions, r(448)=.54, p<.001, indicating that students with stronger peer networks had higher intentions to persist.”
Multiple Regression:
- Predict outcome variable from multiple predictors
- Shows which variables matter most
Example:
“Multiple regression revealed that peer support (β=.38, p<.001), academic self-efficacy (β=.26, p<.01), and financial security (β=.18, p<.05) significantly predicted retention intentions, R²=.42, F(3,446)=108.2, p<.001.”
Testing Independence:
Chi-square:
- Test relationship between two categorical variables
- Example: Is retention (stayed/left) related to intervention (yes/no)?
Reporting:
“Retention rates differed significantly by condition, χ²(1, N=450)=8.92, p=.003. Students in the intervention group showed 82% retention compared to 71% in the control group.”
Understanding P-Values and Significance
p-value: Probability of getting your results if the null hypothesis is true.
Convention:
- p<.05: Statistically significant (less than 5% chance results are due to random chance)
- p<.01: Highly significant
- p<.001: Very highly significant
Critical: p-value alone doesn’t tell you if effect is meaningful. Always report effect sizes.
Effect Sizes
Why they matter: Statistical significance tells you IF there’s an effect. Effect size tells you HOW BIG.
With large samples, tiny differences can be “significant” but meaningless.
Cohen’s d (for t-tests):
- 0.2 = small effect
- 0.5 = medium effect
- 0.8 = large effect
Eta-squared (η²) for ANOVA:
- .01 = small
- .06 = medium
- .14 = large
R-squared (R²) for regression:
- Proportion of variance explained
- .10 = 10% of variance explained
Software Options
SPSS:
- User-friendly, point-and-click interface
- Common in social sciences, education, psychology
- Expensive but many universities provide licenses
R:
- Free, open-source
- Powerful, flexible
- Steeper learning curve
- Excellent for advanced statistics
Stata:
- Common in economics, public health
- Good for panel data and econometrics
Excel:
- Basic statistics only
- NOT recommended for serious research
Qualitative Data Analysis
Step 1: Familiarize Yourself with Data
Before coding:
- Read all transcripts or field notes thoroughly
- Make initial notes and impressions
- Identify potential patterns
Step 2: Coding Data
Coding: Assigning labels to segments of data.
Open coding:
- Read through data line-by-line
- Assign codes to meaningful segments
- Be descriptive (codes = short labels summarizing content)
Example:
Transcript excerpt: “My mentor really helped me when I was struggling with chemistry. I would have quit without her.”
Codes: [academic support], [peer mentoring], [persistence factor]
Develop codebook:
- Code name
- Definition
- When to use
- When NOT to use
- Example
Step 3: Identify Themes
Themes: Patterns across codes that capture important aspects of data.
Process:
- Group related codes together
- Identify overarching themes
- Define each theme clearly
- Find representative quotes
Example analysis:
Theme 1: Peer Mentors as Safety Nets
- Definition: Mentors provide critical support during academic or personal crises
- Codes included: academic support, emotional support, crisis intervention
- Prevalence: 27 of 30 interviews
Representative quote:
“When I was failing math and wanted to drop out, my mentor spent hours helping me every night. Without her, I wouldn’t be here” (Participant 7, female, Science).
Step 4: Ensure Trustworthiness
Strategies:
Member checking:
- Share findings with participants
- Ask if your interpretation resonates
- Revise based on feedback
Triangulation:
- Multiple data sources (interviews + observations + documents)
- Multiple researchers coding independently
- Compare interpretations
Thick description:
- Provide rich, detailed descriptions
- Enough context for readers to assess transferability
Audit trail:
- Document your analytical decisions
- Keep record of code development
- Show your reasoning process
Qualitative Software
NVivo:
- Industry standard
- Organize transcripts, code data, query patterns
- Expensive but powerful
ATLAS.ti:
- Similar to NVivo
- Strong for theory building
MAXQDA:
- User-friendly
- Good for mixed methods
Free options:
- Dedoose (cloud-based, affordable)
- Manual coding (highlight printouts, use spreadsheets)
Important: Software helps organize, but YOU do the analysis. Software doesn’t interpret meaning—you do.
Mixed Methods Analysis
Integration Strategies
Merge:
- Combine quantitative and qualitative databases
- Compare findings side-by-side
Example table:
| Finding | Quantitative Evidence | Qualitative Evidence |
| Peer support predicts retention | r=.54, p<.001 | 27/30 participants cited mentor support as critical |
Connect:
- Use quantitative results to inform qualitative sampling
- Example: Survey identifies high vs. low retainers → Interview both groups to understand why
Embed:
- One method supports the other
- Example: Brief interviews explain unexpected quantitative findings
Presenting Results Effectively
Narrative Results Section
Structure:
1. Restate purpose (1 sentence)
“This study examined the impact of peer mentoring on first-year retention.”
2. Present findings systematically
- Organize by research question or hypothesis
- Quantitative → qualitative → integration (for mixed methods)
3. Use clear topic sentences
“Hypothesis 1 predicted that students receiving peer mentoring would show higher retention than controls. This hypothesis was supported.”
4. Report statistics completely
- Always include: test statistic, degrees of freedom, p-value, effect size
- Example: t(448)=7.3, p<.001, d=0.74
5. Refer to tables/figures
“As shown in Table 1, retention rates were consistently higher in the intervention group across all three colleges.”
Creating Effective Tables
Good table characteristics:
- Clear, descriptive title
- Column headers well-labeled
- Numbers aligned properly
- Include sample sizes (n)
- Note statistical significance (* p<.05, ** p<.01)
Example table:
Table 1
Retention Rates by Condition and College
| College | Intervention n (%) | Control n (%) | χ² | p |
| College A | 82 (83%) | 35 (70%) | 4.12 | .042* |
| College B | 86 (86%) | 39 (78%) | 2.34 | .126 |
| College C | 78 (78%) | 33 (66%) | 3.45 | .063 |
| Total | 246 (82%) | 107 (71%) | 8.92 | .003 |
Note. n = sample size. * p<.05, ** p<.01.
Creating Effective Figures
When to use:
- Bar charts: Compare categories
- Line graphs: Show trends over time
- Scatter plots: Show relationships
- Box plots: Show distributions
Figure requirements:
- Descriptive caption
- Labeled axes with units
- Legend if needed
- High resolution
- Black and white friendly (for print)
Common Analysis Mistakes
Mistake 1: Ignoring Assumptions
Problem: Using tests without checking if data meets requirements.
Example: Using t-test when data is severely skewed (violates normality assumption)
Solution: Check assumptions first. Use non-parametric alternatives if assumptions violated.
Mistake 2: P-Hacking
Problem: Running many tests until finding p<.05, only reporting significant ones.
This is misconduct. It inflates false positives.
Solution: Pre-register hypotheses. Report all tests run, not just significant ones.
Mistake 3: Confusing Correlation with Causation
Problem: Finding correlation, claiming causation.
Wrong – “Peer support causes retention” (from correlational data)
Right – “Peer support is associated with retention” OR “Peer support predicts retention”
Only experiments can establish causation.
Mistake 4: Cherry-Picking Qualitative Quotes
Problem: Only presenting quotes that support your interpretation.
Solution: Present data representing the full range of responses. Note exceptions and contradictions.
Mistake 5: Over-Interpreting Small Samples
Problem: Claiming “students feel…” based on 5 interviews.
Solution: Qualify claims appropriately. “These 5 participants described…” or “In this small sample…”
Writing the Results Section
Results vs. Discussion
Results section:
- Right –What you found
- Wrong –What it means (that’s Discussion)
Example:
Results (correct):
“Retention rates were significantly higher in the intervention group (82%) compared to controls (71%), χ²(1, N=450)=8.92, p=.003.”
NOT in Results:
“This shows that peer mentoring is an effective retention strategy that colleges should implement.” (This interpretation belongs in Discussion)
Results Checklist
Before submitting, verify:
- All research questions addressed
- Statistical tests reported completely
- Tables/figures referenced in text
- No interpretation (save for Discussion)
- Sample sizes clear
- No contradictions with methods section
Legal Research and Writing: Complete Guide for Law Students and Legal Researchers
Conclusion
Data analysis transforms raw information into meaningful findings. Whether analyzing numbers, interview transcripts, or judicial decisions, systematic analysis is essential.
- For quantitative researchers: Choose appropriate statistical tests, check assumptions, report completely, interpret cautiously.
- For qualitative researchers: Code systematically, identify themes carefully, ensure trustworthiness, present richly.
- For law students: Analyze case law to identify principles, trace evolution, synthesize doctrine; use empirical methods for socio-legal research.
For everyone: Analysis quality determines research credibility. Master these methods—your research depends on it.
Q: What is data analysis in research?
Data analysis is the systematic process of examining, cleaning, transforming, and modelling data to discover patterns, test hypotheses, and draw conclusions. For quantitative research, it involves statistical procedures — descriptive and inferential statistics. For qualitative research, it involves interpretive procedures — coding, theme development, and synthesis. The goal in both cases is to move from raw data to findings that answer the research question. Analysis must be planned before data collection, not invented after.
Q: What is the difference between data analysis and data interpretation?
Data analysis is what the data shows — patterns, frequencies, statistical relationships, themes. Data interpretation is what those patterns mean — why they occurred, what they imply for theory and practice, how they connect to existing knowledge. Analysis belongs in the Results section; interpretation belongs in the Discussion. Mixing the two is the most common structural error in research papers. Report first, interpret second — always in separate sections.
Q: How do you choose the right data analysis method?
Your analysis method is determined by your research question, research design, and data type. For quantitative data asking about relationships: correlations or regression. For group differences: t-tests or ANOVA. For categorical outcomes: chi-square or logistic regression. For qualitative data exploring experience or meaning: thematic analysis, grounded theory, or discourse analysis. The method must be specified in your methodology chapter before data collection — choosing after seeing the data introduces bias.
Q: How do you present data analysis findings in a research paper?
Present findings in the Results section without interpretation. For quantitative findings: report descriptive statistics first, then inferential test results with effect sizes; use tables for complex data and figures for trends. For qualitative findings: organise around themes, present each with analytical prose and supporting quotes. For legal research: present doctrinal findings as structured legal propositions, not summaries. Every table and figure must be referenced in text before it appears.
Q: What software is used for data analysis in research?
Common quantitative analysis software: SPSS (widely used in social science, psychology, education); R (free, flexible, increasingly preferred for advanced analysis); Stata (economics and health sciences); Excel (basic descriptive statistics only). Common qualitative analysis software: NVivo (most widely used for qualitative coding); Atlas.ti; MAXQDA. For legal research: SCC Online and Manupatra for case law analysis; no specialist software replaces legal reasoning for doctrinal analysis.
Author
Dr. Rekha Khandelwal, a legal scholar and academic writing expert, is the founder of AspirixWriters. She has extensive experience in guiding students and researchers in writing research papers, theses, and dissertations with clarity and originality. Her work focuses on ethical AI-assisted writing, structured research, and making academic writing simple and effective for learners worldwide.
Author Profile Dr. Rekha Khandelwal | Academic Writer, Legal Technical Writer, AI Expert & Author | AspirixWriters
References
- Field, A. (2024). Discovering Statistics Using IBM SPSS (6th ed.). Sage Publications.
- Saldaña, J. (2021). The Coding Manual for Qualitative Researchers (4th ed.). Sage Publications.
- Braun, V., & Clarke, V. (2022). Thematic Analysis: A Practical Guide (2nd ed.). Sage Publications.
- Creswell, J. W., & Creswell, J. D. (2022). Research Design: Qualitative, Quantitative, and Mixed Methods Approaches (6th ed.). Sage.
Part of: Complete Research Writing Guide Series
- Preparing Your Data: The Work That Determines Analysis Quality
- Descriptive Statistics: What to Report and How to Read Them
- Inferential Statistics: Choosing and Reporting the Right Test
- Statistical Assumptions: The Checks Most Researchers Skip
- Presenting Qualitative Findings: Quotes, Themes, and the Balance Between Showing and Telling
- Writing the Results Section: Separating Findings from Interpretation
Module 2 –The Academic Writing Process: Complete Guide from First Draft to Submission (2026)
Next in Series:
- Complete Guide: Data Analysis and Results Presentation: Complete Guide for Quantitative, Qualitative & Legal Research (2026) (Module 4)
- Complete Guide: Organization and Academic Tone: Complete Guide to Professional Scholarly Writing (2026) (Module 5)
- Complete Guide: Peer Review and Publication: Complete Guide from Submission to Acceptance (2026) (Module 6)
- Complete Guide: AI Tools in Academic Research: Opportunities, Ethics, and Best Practices (2026) (Module 7)
- Complete Guide: Grant Writing and Research Funding: Complete Guide to Finding Money for Your Research (2026) (Module 8)
- Complete Guide: Academic Career Development: Complete Guide to Building Your Professional Life in Research (2026) (Module 9)
- Complete Guide: Research Ethics and the IRB Process: Complete Guide to Doing Research Responsibly (2026) (Module 10)

The Complete Guide to Research Paper Structure: IMRAD Format, Thesis Organization & Academic Writing (2026)
From Concept to Submission: A Complete Guide to Research Paper and Thesis Writing Academic Writing…
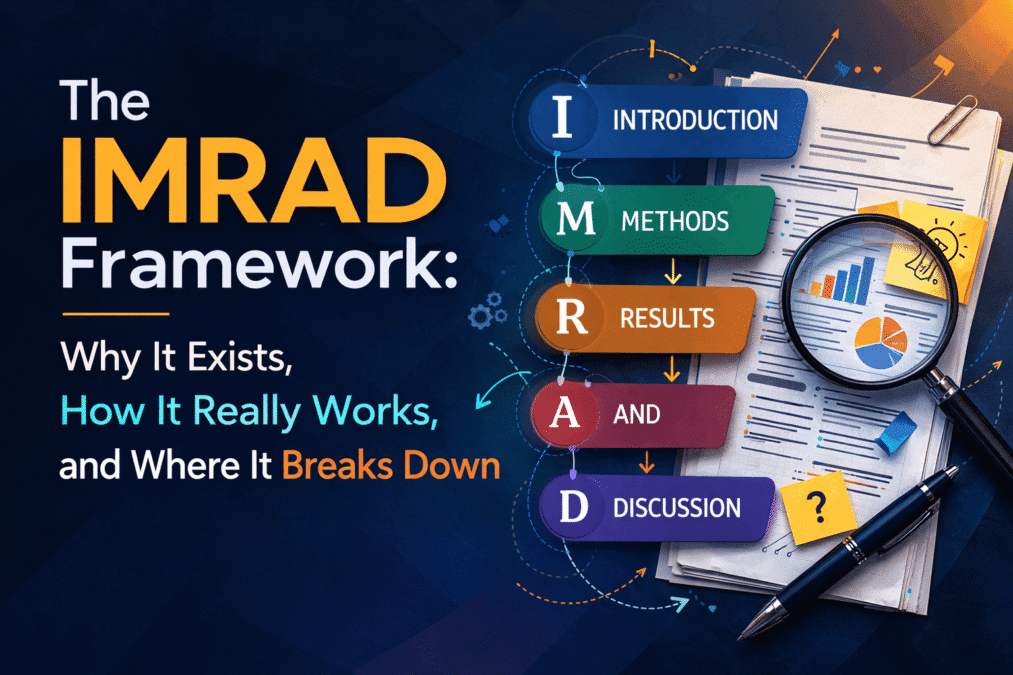
The IMRAD Framework: Why It Exists, How It Really Works, and Where It Breaks Down
The IMRAD Framework Understanding the Structure of Research Papers and Theses – Module 1: From Concept…

How to Write a Research Introduction That Reviewers Cannot Ignore
How to Write a Research Introduction Module 1: Understanding the Structure of Research Papers and…

How to Write a Methods Section That Reviewers Will Trust
How to Write a Methods Section Module 1: Understanding the Structure of Research Papers and…
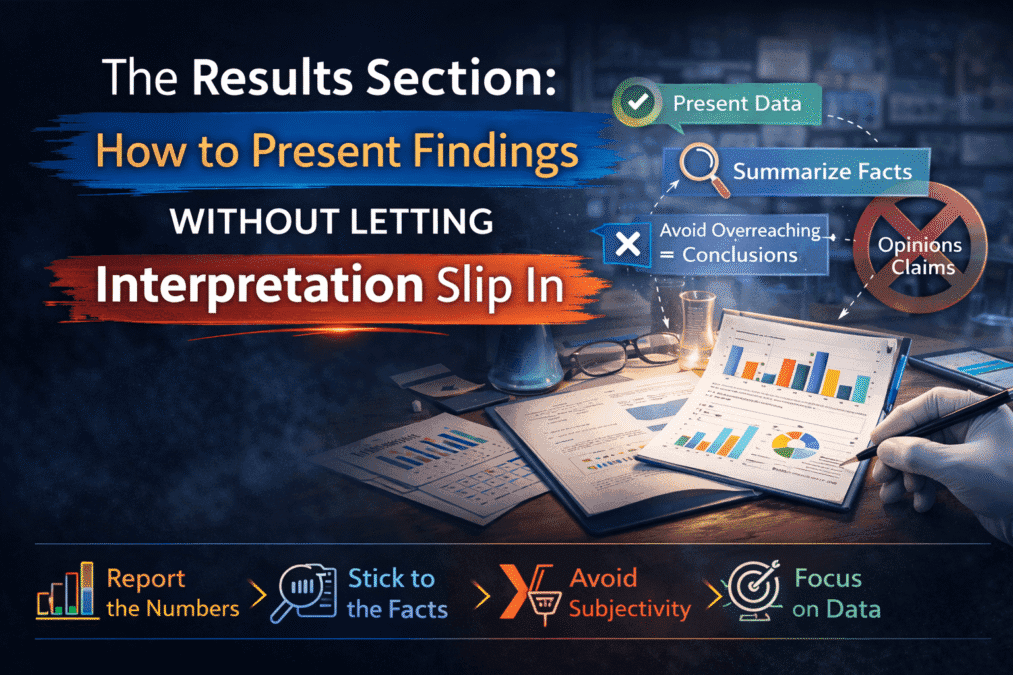
The Results Section: How to Present Findings Without Letting Interpretation Slip In
The Results Section Module 1: Understanding the Structure of Research Papers and Theses From Concept…
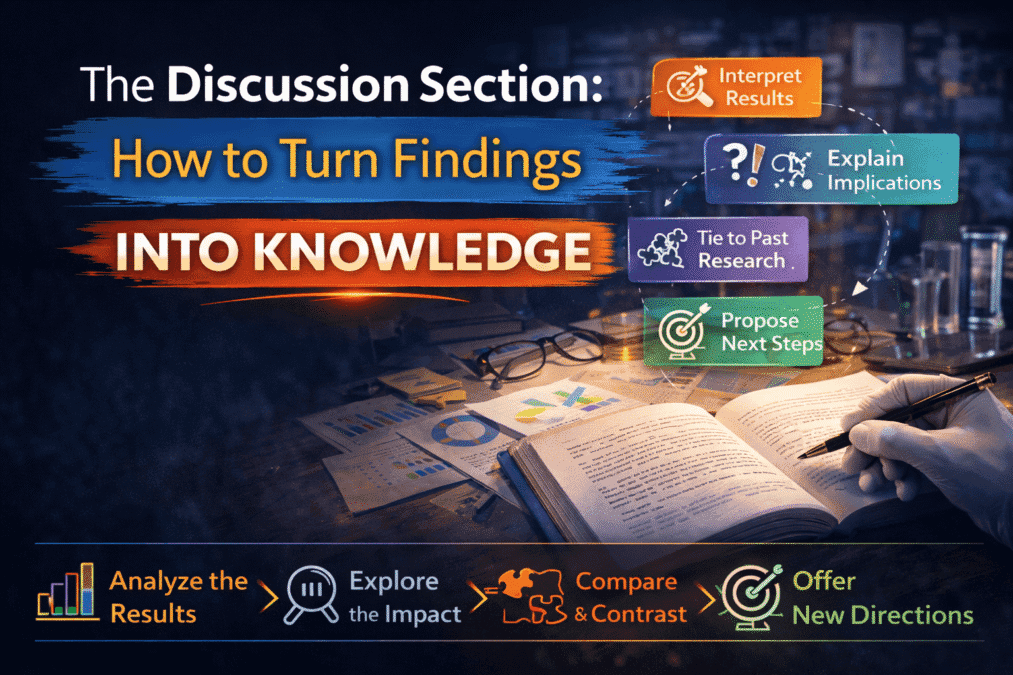
The Discussion Section: How to Turn Findings Into Knowledge
The Discussion Section Module 1: Understanding the Structure of Research Papers and Theses From Concept…
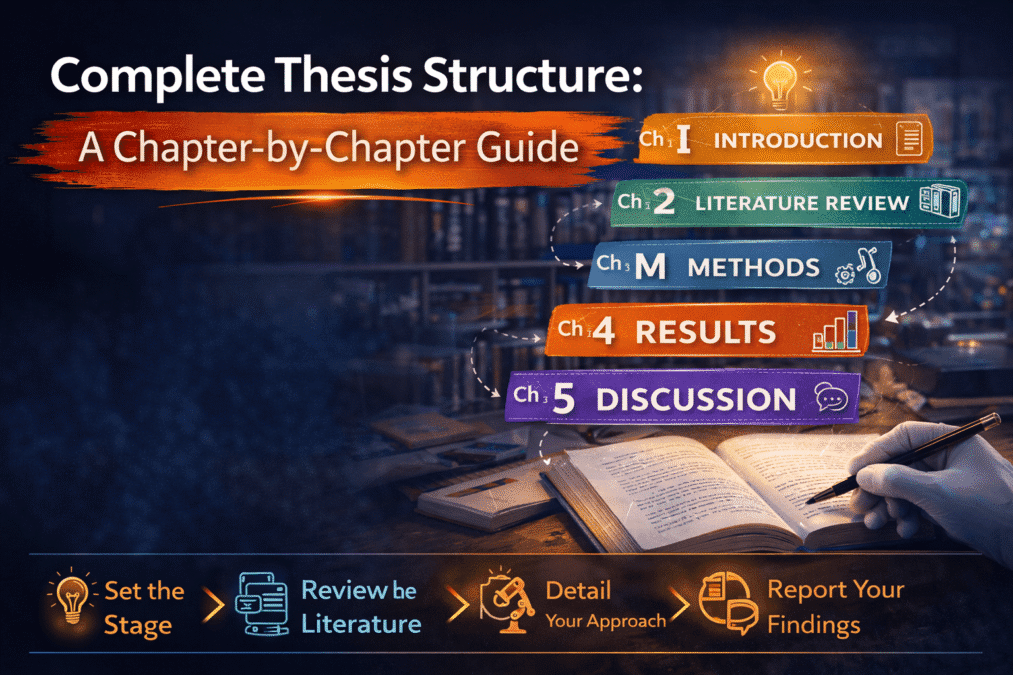
Complete Thesis Structure: A Chapter-by-Chapter Guide
Complete Thesis Structure Module 1: Understanding the Structure of Research Papers and Theses From Concept…

10 Structural Mistakes That Get Research Papers Rejected — And How to Fix Every One
10 Structural Mistakes That Get Research Papers Rejected Module 1: Understanding the Structure of Research…

How to Write a Journal Abstract That Gets Your Paper Read
How to Write a Journal Abstract Module 1: Understanding the Structure of Research Papers and…
Systematic Review and PRISMA: How to Conduct and Report a Review That Meets Publication Standards
Systematic Review and PRISMA Module 1: Understanding the Structure of Research Papers and Theses From…

Legal Research Methods: A Complete Guide to Doctrinal, Empirical and Comparative Legal Research
Legal Research Methods Module 1: Understanding the Structure of Research Papers and Theses From Concept…

The Academic Writing Process: Complete Guide from First Draft to Submission (2026)
Module 2, Complete Guide: The Academic Writing Process – from First Draft to Submission From…
How to Start Writing and Keep Going
How to Start Writing Module 2: The Academic Writing Process From Concept to Submission Series …

How to Write Clear Engaging Academic Prose
How to Write Clear Engaging Academic Prose – Module 2: The Academic Writing Process From…
The Revision Process: How to Turn a Draft Into a Submission
The Revision Process Module 2: The Academic Writing Process From Concept to Submission Series | …
Citation Styles Explained: APA, MLA, Chicago, IEEE, and Bluebook
Citation Styles Explained Module 2: The Academic Writing Process From Concept to Submission Series | …
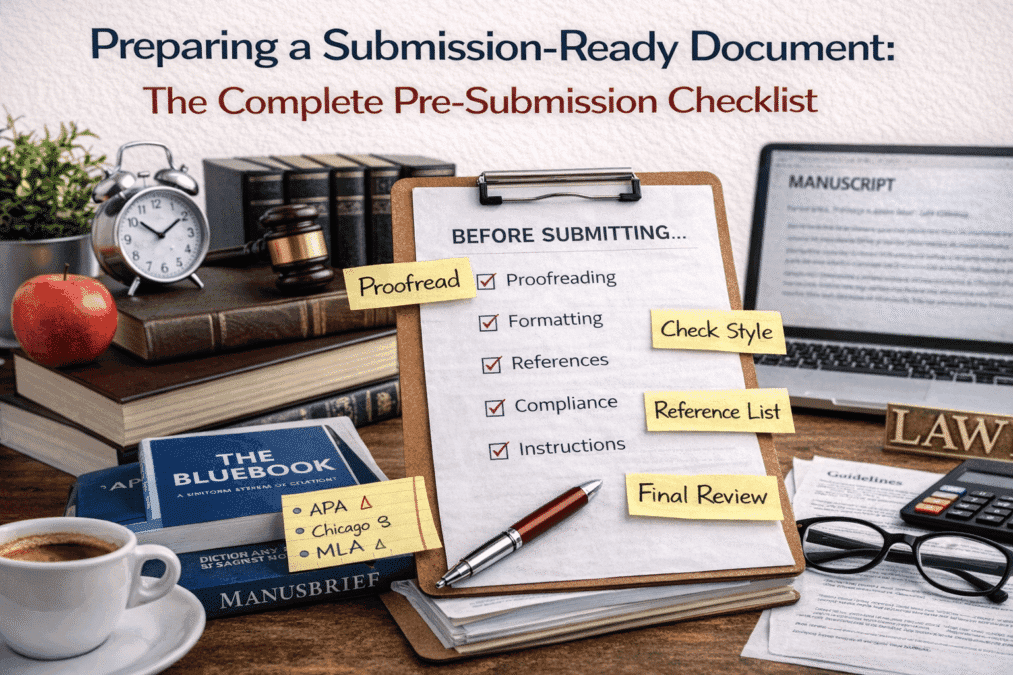
Preparing a Submission Ready Document: The Complete Pre-Submission Checklist
Preparing a Submission Ready Document Module 2: The Academic Writing Process From Concept to Submission…
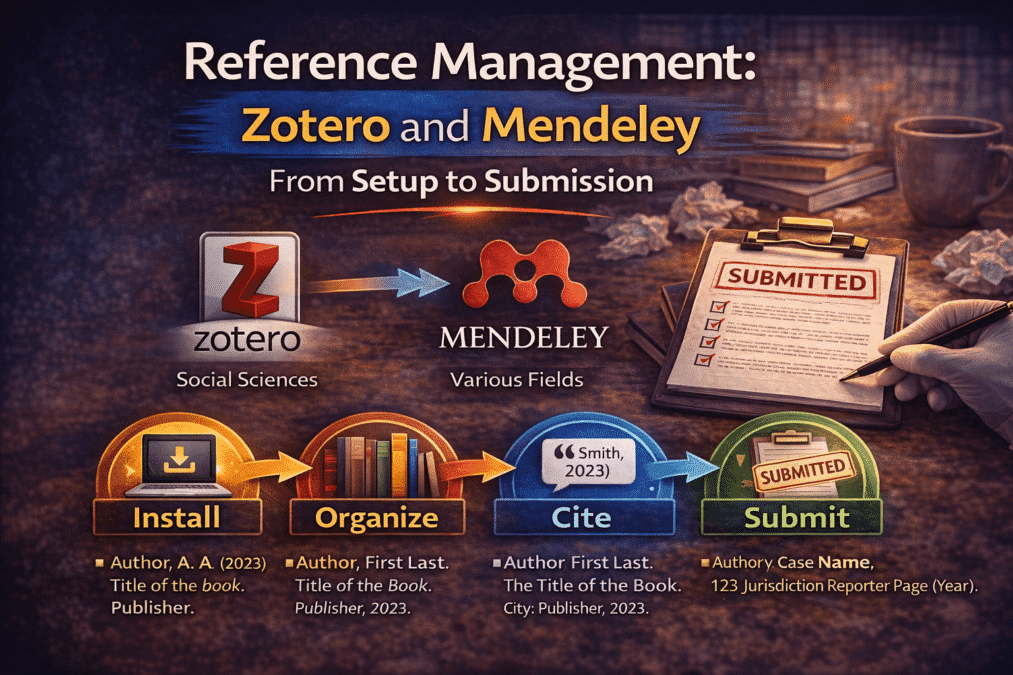
Reference Management: Zotero and Mendeley from Setup to Submission
Reference Management Module 2: The Academic Writing Process From Concept to Submission Series | 2026 Academic…

Legal Writing Process and Citation: A Complete Guide for Law Students and Legal Researchers
Legal Writing Process and Citation Module 2: The Academic Writing Process From Concept to Submission…
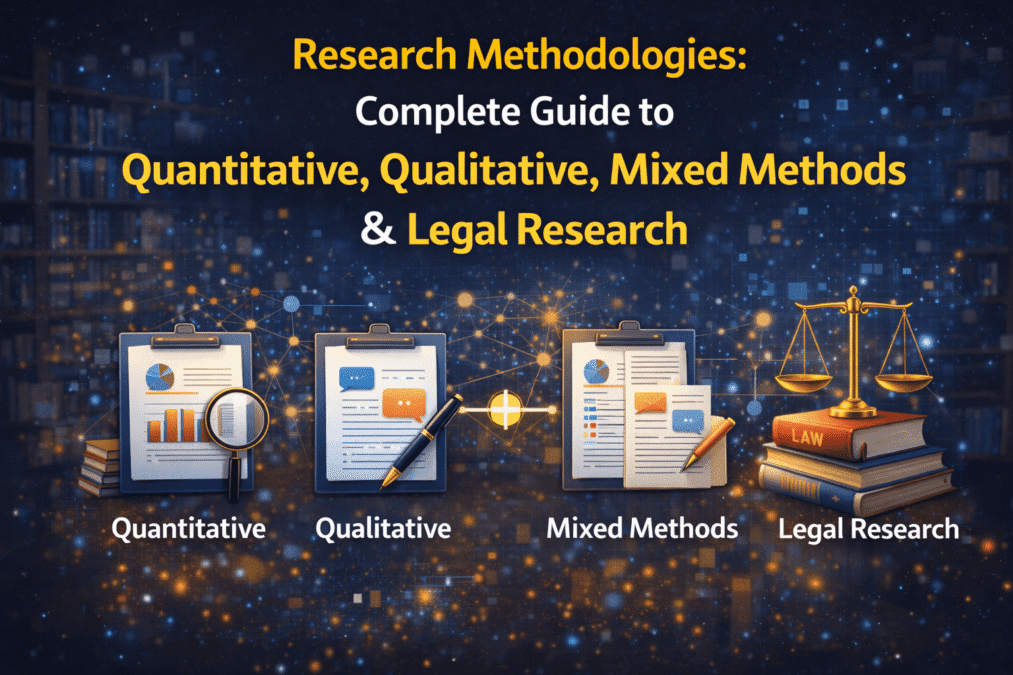
Research Methodologies: Complete Guide to Quantitative, Qualitative & Mixed Methods (2026)
(Module 3) – Complete Guide Research Methodologies From Concept to Submission: A Complete Guide to…

Research Paradigms: Why Your Philosophical Stance Shapes Everything
Research Paradigms Module 3: Research Methodologies From Concept to Submission Series | 2026 Academic Writing Mastery:…
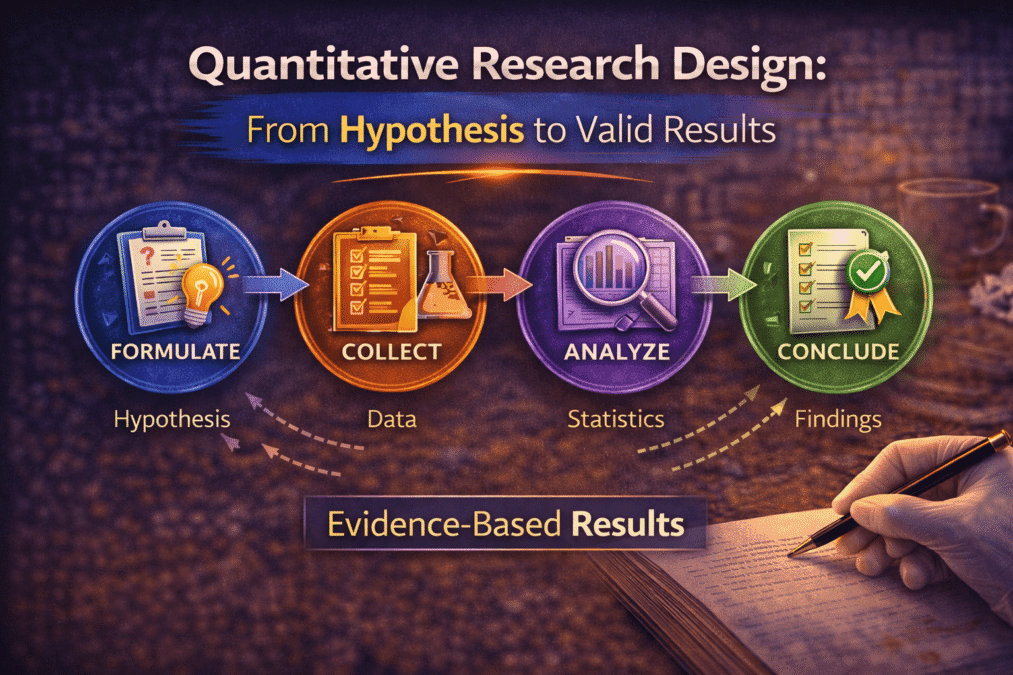
Quantitative Research Design: From Hypothesis to Valid Results
Quantitative Research Design Module 3: Research Methodologies From Concept to Submission Series | 2026 Academic…
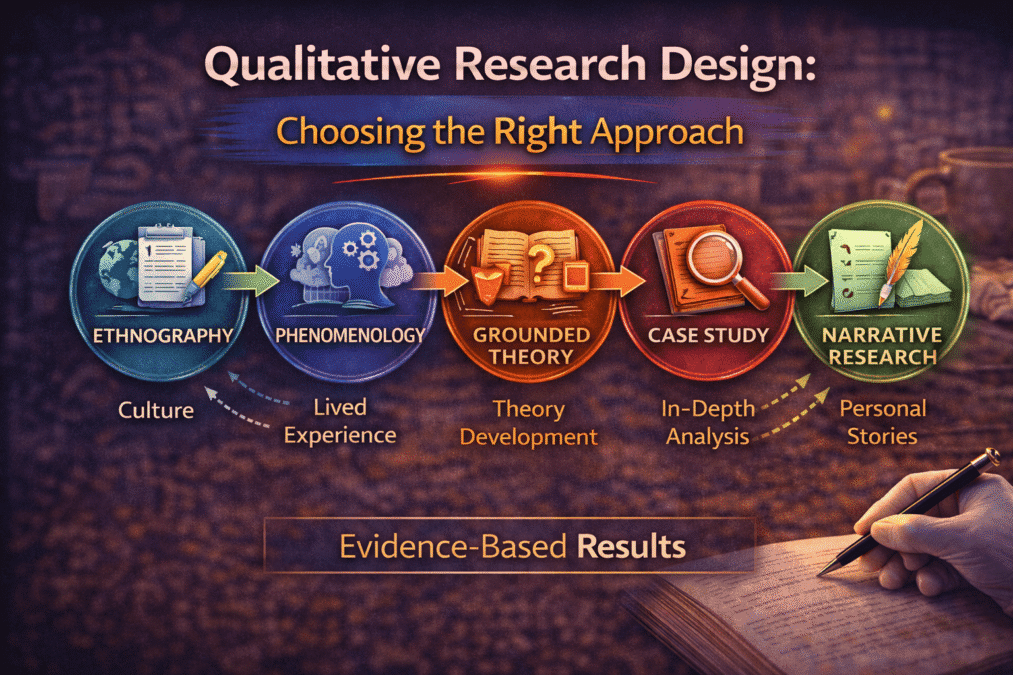
Qualitative Research Design: Choosing the Right Approach
Qualitative Research Design Module 3: Research Methodologies From Concept to Submission Series | 2026 Academic…
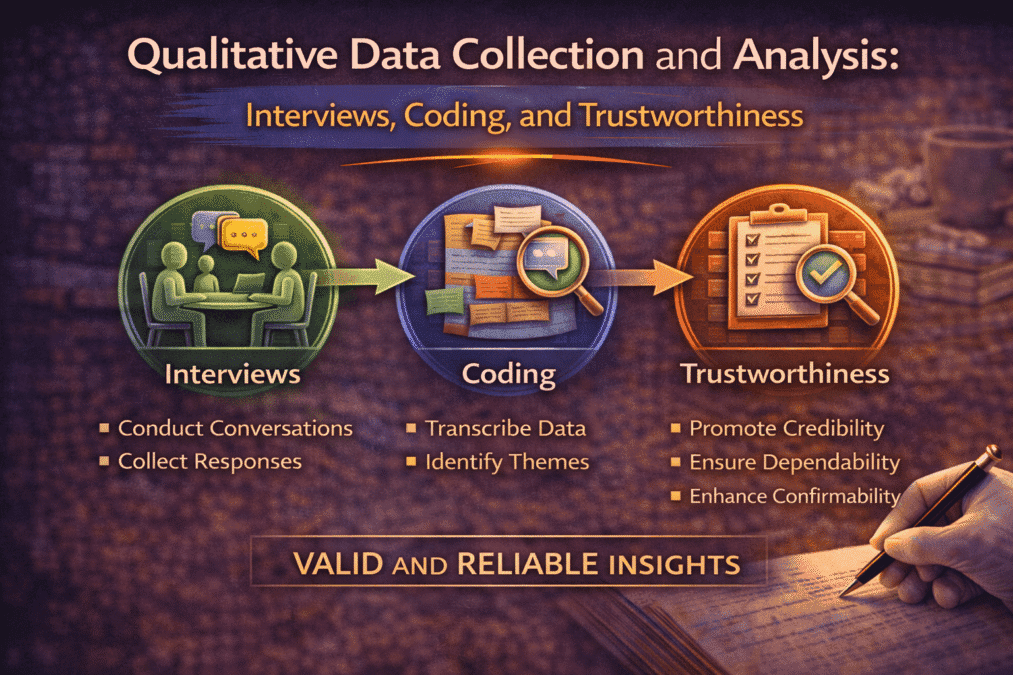
Qualitative Data Collection and Analysis: Interviews, Coding, and Trustworthiness
Qualitative Data Collection and Analysis Module 3: Research Methodologies From Concept to Submission Series | …
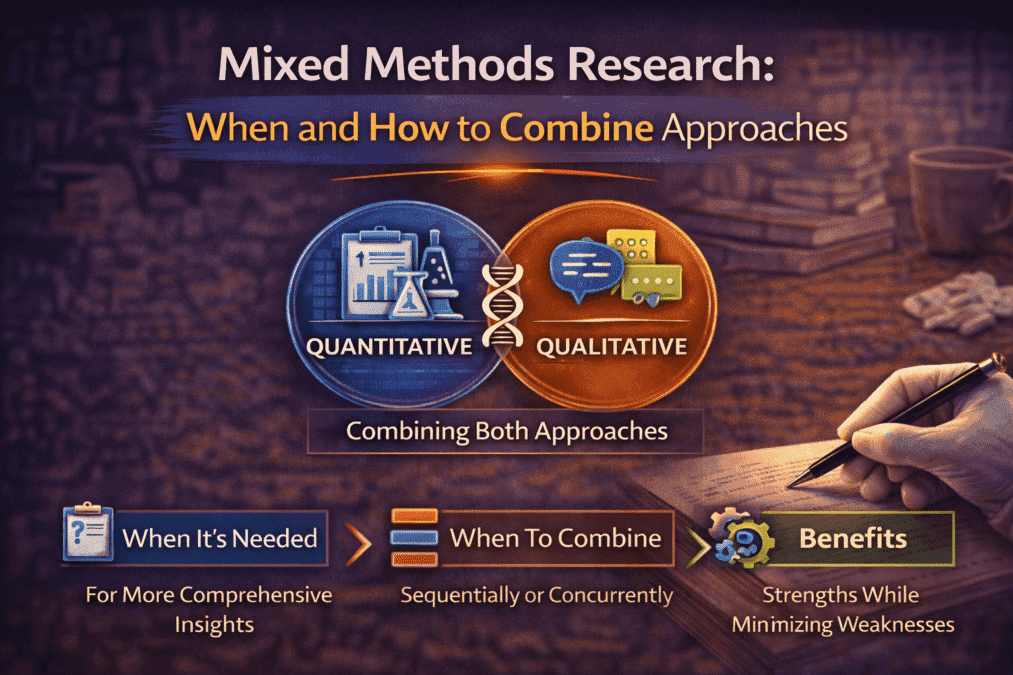
Mixed Methods Research: When and How to Combine Approaches
Mixed Methods Research Module 3: Research Methodologies From Concept to Submission Series | 2026 Academic…
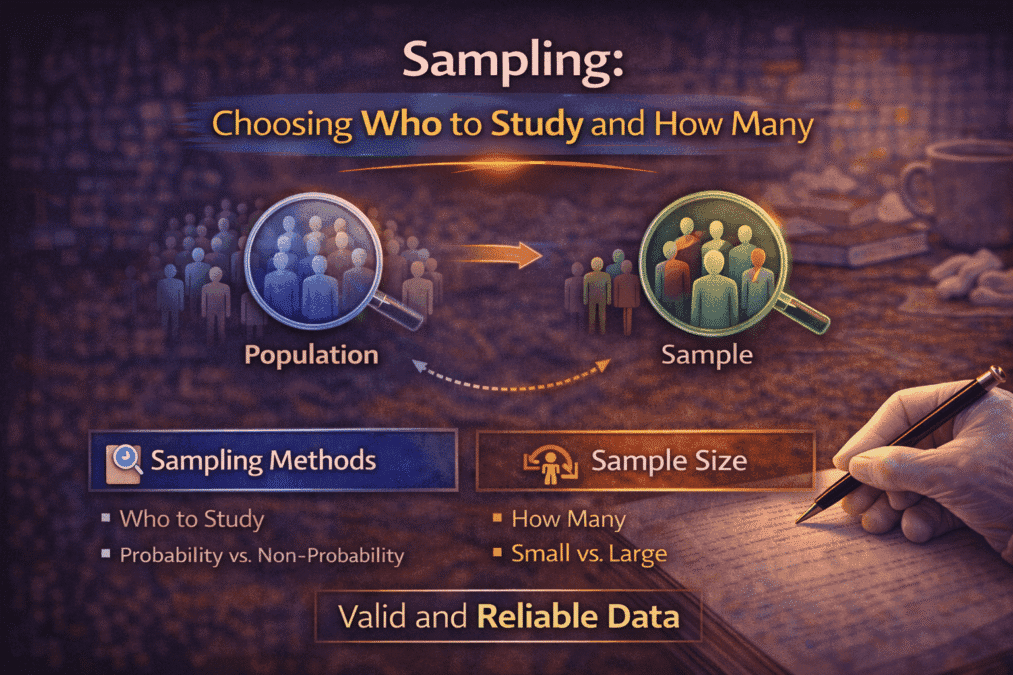
Sampling: Choosing Who to Study and How Many
Sampling Module 3: Research Methodologies From Concept to Submission Series | 2026 Academic Writing Mastery:…
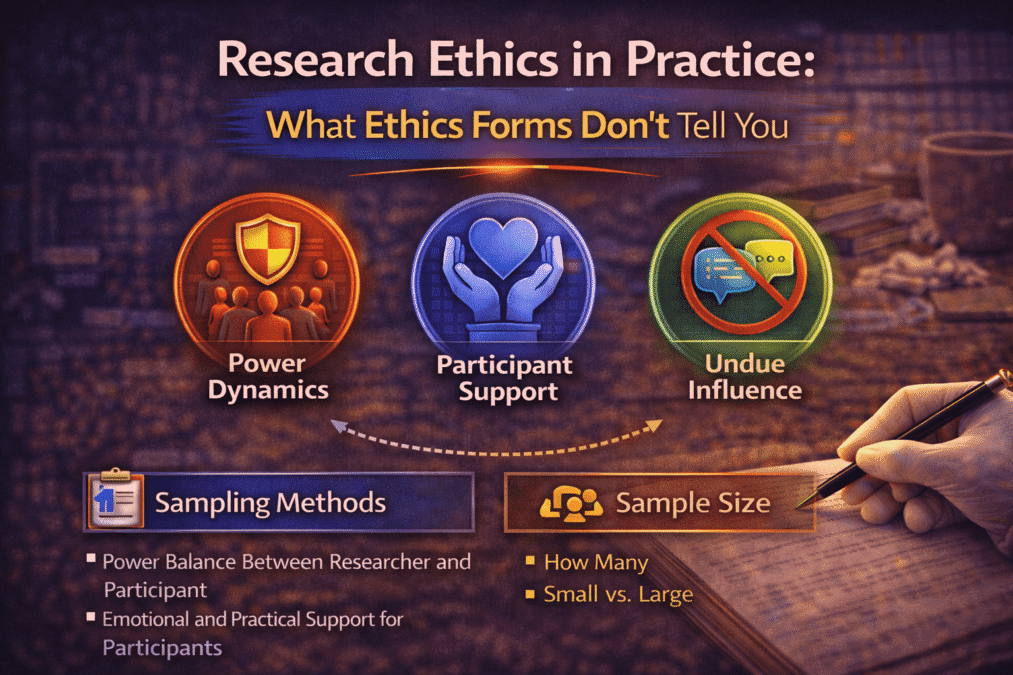
Research Ethics in Practice: What Ethics Forms Don’t Tell You
Research Ethics in Practice Module 3: Research Methodologies From Concept to Submission Series | 2026…
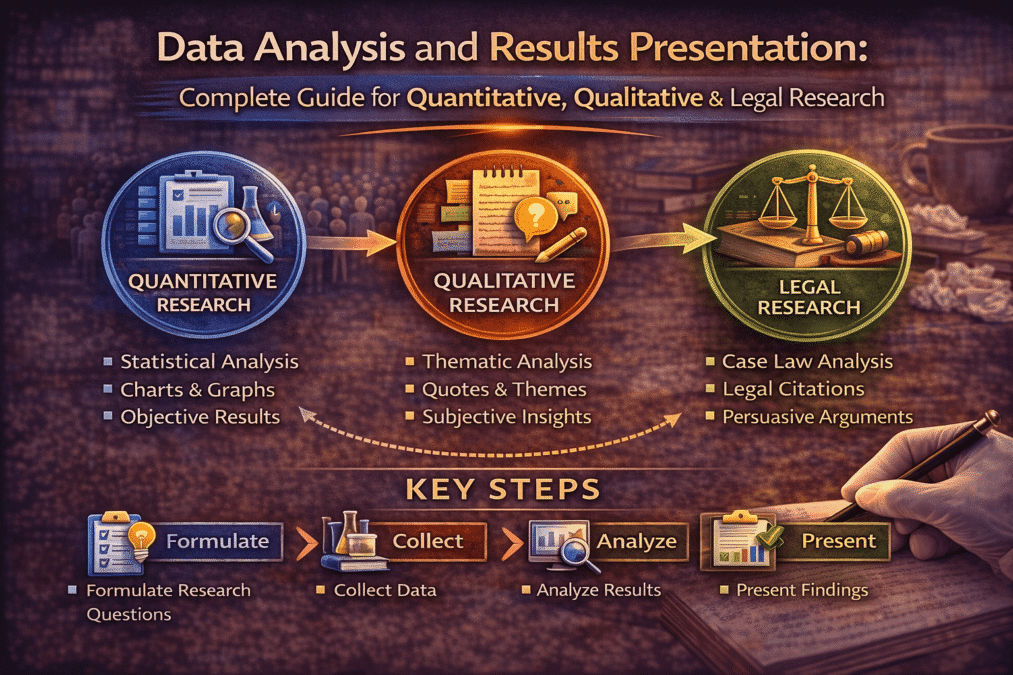
Data Analysis and Results Presentation: Complete Guide for Quantitative & Qualitative Research (2026)
(Module 4) Data Analysis and Results Presentation: From Concept to Submission: A Complete Guide to…

Preparing Your Data: The Work That Determines Analysis Quality
Cluster Post 1 | Module 4: Data Analysis and Presenting Results From Concept to Submission…
Descriptive Statistics: What to Report and How to Read Them
Cluster Post 2 | Module 4: Data Analysis and Presenting Results From Concept to Submission…