Last Updated: March 31, 2026
Quantitative Research Design
Module 3: Research Methodologies
From Concept to Submission Series | 2026
Academic Writing Mastery: The Complete 2026 Guide To Research Papers, Thesis & Dissertation Writing
Module 1 (Complete Guide)- The Complete Guide To Research Paper Structure: IMRAD Format, Thesis Organization & Academic Writing (2026)
Module 2 (Complete Guide) –The Academic Writing Process: Complete Guide from First Draft to Submission (2026)

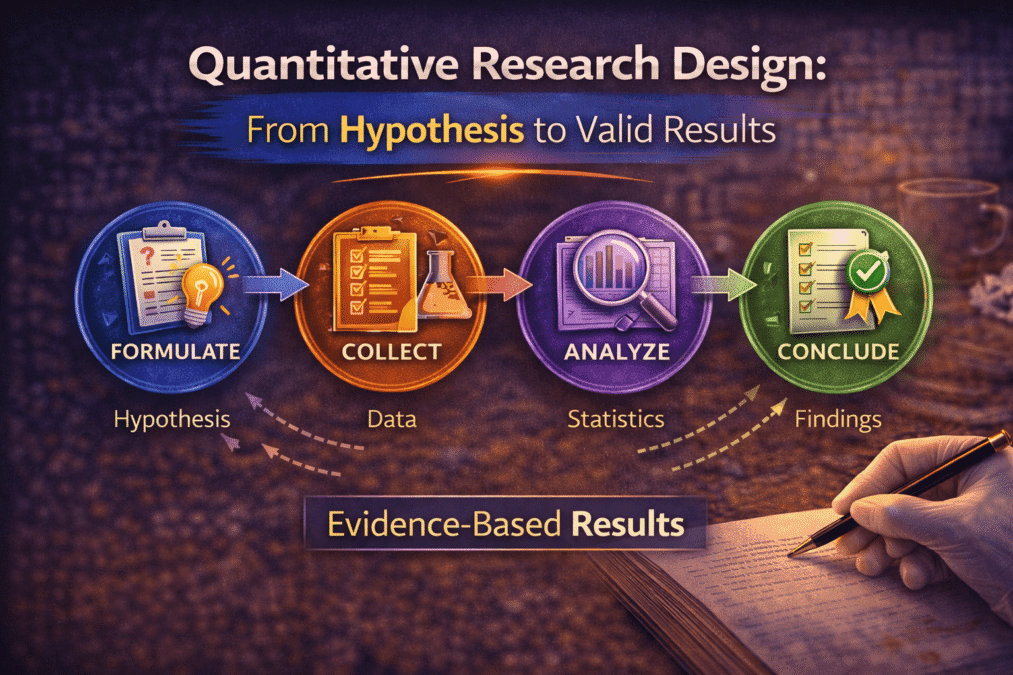
Quantitative Research Design: From Hypothesis to Valid Results
The module overview introduced experimental, survey, and correlational designs. This post goes deeper: how to operationalise variables rigorously, the distinction between internal and external validity and why it matters, how to determine your sample size before you collect data, and the specific threats to validity that reviewers look for in quantitative studies.
Starting Right: The Hypothesis
A research question asks what you want to know. A hypothesis states, in advance, what you expect to find and why. The difference matters more than it sounds.
Hypotheses make your reasoning visible and testable. When you articulate a specific prediction before collecting data, you commit to a logic that can be evaluated: if the data support the prediction, the reasoning behind it gains credibility; if they do not, the reasoning needs revision. This is the mechanism through which quantitative research builds knowledge.
A good hypothesis has three properties. It is specific — naming the exact variables and the direction of the expected relationship. It is grounded — derived from theory or prior research, not from intuition alone. And it is falsifiable — stated in a way that clearly defines what evidence would contradict it.
Weak hypothesis: “Peer mentoring will affect student retention.” Strong hypothesis: “Students who receive peer mentoring with weekly contact frequency will show significantly higher first-year retention rates than students in a no-mentoring control condition, after controlling for socioeconomic status and prior academic achievement (predicted direction: positive effect; predicted mechanism: social integration).”
The strong version names the comparison condition, specifies the direction, identifies the control variables, and states the theoretical mechanism. This level of specificity serves a practical purpose beyond academic rigour: it defines your analysis plan before you collect a single data point, which protects against the temptation to adjust your hypotheses after seeing your data.
Operationalisation: Turning Concepts Into Measurements
Operationalisation is the process of defining exactly how you will measure an abstract concept. It is where most measurement error enters quantitative research, and it receives far less attention in methods courses than it deserves.
Consider “peer mentoring.” As a concept, it refers to a supportive relationship between peers that facilitates learning and adjustment. But as a variable in a study, it needs a precise operational definition: Is it the presence or absence of a formal mentoring assignment? The frequency of mentor contact? The quality of the relationship as rated by the mentee? The number of topics discussed? Each operationalisation captures a different aspect of the concept and will produce different results.
The choice of operationalisation is a theoretical claim. When you decide to measure peer mentoring as weekly contact frequency, you are claiming that frequency is the most important dimension — that what matters about mentoring is how often it occurs, not what is said or how the mentee feels about it. This claim should be justified by theory or prior research, not assumed by default.
The two tests every measure must pass
Reliability means the measure gives consistent results. Test-retest reliability checks whether the same participant scores similarly on two occasions close together in time (when no real change has occurred). Inter-rater reliability checks whether two coders independently assign the same codes or scores to the same data. Cronbach’s alpha checks whether items in a scale correlate with each other as expected. Report whichever form of reliability is relevant to your measure, and verify it in your own sample — a scale that was reliable with US undergraduates may not be reliable with Indian government college students.
Validity means the measure actually measures what it claims to. Face validity asks whether the items look relevant to the construct — a necessary but insufficient check. Content validity asks whether the measure covers the full domain of the construct, not just part of it. Criterion validity asks whether scores correlate with other measures they should correlate with. Construct validity — the most demanding test — asks whether the measure behaves as the theory predicts it should across a range of conditions.
When using a published instrument, report the reliability and validity evidence from the original validation study, and then report your own reliability estimates from your sample. Both are required. Saying “the scale was validated by Smith (2019)” without reporting your own alpha is insufficient — you need to show the scale worked in your specific sample.
Research Designs: Choosing the Right One for Your Question
True experiments: the only design that establishes causation
True experiments require two elements: manipulation of the independent variable (you create the conditions, rather than measuring pre-existing ones) and random assignment of participants to conditions. Random assignment is what makes experiments the gold standard for causal inference — it distributes both known and unknown confounding variables across conditions, so that any difference observed between conditions can be attributed to the manipulation rather than to pre-existing differences between participants.
The most common mistake in reading experimental results: confusing statistical significance with practical significance. A study with N = 2,000 can detect very small effects as statistically significant. An effect of d = 0.08 (less than one-tenth of a standard deviation difference between groups) might be statistically significant with a large enough sample but utterly trivial in practice. Always report and interpret effect sizes alongside p-values.
Quasi-experiments: when random assignment is not possible
In most educational and social research, random assignment is not feasible. You cannot randomly assign students to different schools, teachers to different classrooms, or regions to different policy regimes. Quasi-experimental designs compare groups that were not randomly assigned — which means pre-existing differences between groups are a persistent threat to valid causal inference.
The critical question for any quasi-experimental claim is: could a difference between groups be explained by pre-existing differences rather than by the intervention? The standard approaches to addressing this are matching (selecting comparison participants who resemble intervention participants on key variables), regression discontinuity (comparing participants just above and just below a threshold cutoff), and difference-in-differences (comparing change over time between groups, not just levels at one point).
Example: A quasi-experimental study compares retention rates at three colleges that received peer mentoring training with three that did not. Pre-existing differences in student demographics, college resources, and geographic location all threaten the causal interpretation. Addressing this requires either demonstrating baseline equivalence on key variables or using statistical controls — not simply noting the limitation and moving on.
Surveys and correlational designs
Survey and correlational designs are appropriate when you want to describe a population, measure the prevalence of something, or examine associations between variables — but not when you want to establish causation. The correlation-causation distinction is stated in every research methods textbook and violated in nearly every discussion section of every survey study ever written.
The discipline required: when you find a significant correlation between variables A and B, you have three possible interpretations: A causes B, B causes A, or a third variable C causes both. Survey designs cannot distinguish between these possibilities. Your discussion section must acknowledge this explicitly and reason about which interpretation is most plausible given the theory and context — not simply assert the causal interpretation that fits your hypothesis.
Internal and External Validity: The Two Tensions Every Designer Faces
Internal validity is the degree to which your study supports causal inference — the degree to which observed differences between conditions can be attributed to the manipulation rather than to confounds. External validity is the degree to which findings generalise beyond the specific sample, setting, and operationalisation used.
These two forms of validity trade off against each other, and this trade-off is one of the most important constraints in quantitative research design. The tightly controlled laboratory experiment that maximises internal validity does so by creating artificial conditions that may not resemble any real-world setting. The naturalistic study that maximises external validity does so by relinquishing the control that would allow causal inference.
Understanding this trade-off changes how you evaluate and design studies. A finding with high internal validity but low external validity is useful for theory testing but may not inform practice. A finding with high external validity but weak internal validity may be highly relevant to practitioners but should not be interpreted as evidence that the intervention caused the outcome.
| Threat to internal validity | What it means and how to address it |
| Selection bias | Groups differ before the intervention. Address by random assignment or by demonstrating baseline equivalence on key variables. |
| History | Events outside the study affect one group more than another during the study period. Address by simultaneous data collection across conditions. |
| Maturation | Participants change over time regardless of the intervention (students learn throughout the semester). Address by including a control condition. |
| Testing effects | Repeated measurement sensitises participants to the measure. Address by varying measures across time points or using parallel forms. |
| Attrition | Participants drop out non-randomly — those who benefit least may be most likely to leave. Report dropout rates and compare completers to non-completers on baseline variables. |
| Demand characteristics | Participants behave differently because they know they are being studied. Address by blind conditions where possible. |
Sample Size: Determining It Before You Collect Data
The module overview says larger samples are generally better. This section explains the principled way to determine how large your sample needs to be — which is not “as large as I can manage” but a calculation based on what effect you expect and how confident you need to be in detecting it.
Power analysis is the standard method for determining minimum sample size in quantitative research. It requires four inputs:
- Effect size: How large is the effect you expect to find? Use prior research or established benchmarks (Cohen’s d: small = 0.2, medium = 0.5, large = 0.8; r: small = 0.1, medium = 0.3, large = 0.5).
- Alpha level: Your significance threshold — conventionally 0.05, meaning you accept a 5% probability of a false positive.
- Desired power: The probability of detecting the effect if it exists — conventionally 0.80, meaning you accept a 20% probability of missing a real effect.
- Design: The specific statistical test you will use determines the formula.
Free power analysis software (G*Power, available at gpower.hhu.de) calculates required sample size given these inputs. For a two-group comparison (t-test) with a medium effect size (d = 0.5), alpha = .05, and power = .80, the required sample is approximately 64 participants per group — 128 total. For a small effect (d = 0.2), the required sample jumps to approximately 394 per group.
Why this matters for Indian research: many quantitative studies in Indian universities use samples of 50–100 total participants for designs that require several hundred for adequate power. This means these studies are systematically underpowered — they will miss real effects more than 20% of the time, and the effects they do detect may be overestimates of the true effect size (because small samples detect only the largest noise in the data). Reporting a power analysis in your methodology chapter — even a post-hoc one showing what power your achieved sample gave you — signals methodological sophistication that reviewers and examiners notice.
FAQs
Q: What is quantitative research design?
Quantitative research design is the systematic plan for collecting and analysing numerical data to test hypotheses or answer questions about relationships, differences, or patterns. Key design decisions include: experimental vs non-experimental (does the researcher control variables?); cross-sectional vs longitudinal (single timepoint or multiple?); and the unit of analysis (individuals, organisations, events). Each decision affects what causal claims the study can make. Experimental designs establish causation; non-experimental designs establish association.
Q: What is the difference between experimental and non-experimental research?
Experimental research randomly assigns participants to conditions, allowing the researcher to control variables and establish causal relationships. Non-experimental research (surveys, correlational studies, case-control studies) observes existing variation without manipulation — it can establish association but not causation. A randomised controlled trial can prove an intervention causes an outcome. A cross-sectional survey can show two variables are correlated but cannot determine which causes which. The choice depends on your research question and ethical feasibility.
Q: What is internal and external validity in quantitative research?
Internal validity is the degree to which the study accurately measures what it claims to measure — that the independent variable actually caused the change in the dependent variable, not some other factor. External validity is the degree to which findings generalise beyond the study sample. Experimental designs maximise internal validity; large representative samples maximise external validity. Threats to internal validity include selection bias, attrition, and confounding variables. Most real-world studies involve trade-offs between the two.
Q: How do you write a hypothesis for a quantitative research study?
A hypothesis is a specific, testable prediction about the relationship between variables. It must specify: the direction of the relationship (positive, negative, or simply that a relationship exists); the variables involved; and the population. Example: ‘First-year students who participate in peer mentoring will have significantly higher retention rates than those who do not.’ A null hypothesis states no relationship exists. The hypothesis must be falsifiable — if there is no possible data that could disprove it, it is not a hypothesis but an assumption.
Q: What is reliability and validity in research measurement?
Reliability is consistency — a reliable measure produces the same results under the same conditions. Validity is accuracy — a valid measure actually measures what it claims to measure. A bathroom scale that always reads 5kg too heavy is reliable but not valid. An interview that measures confidence but is meant to measure competence is unreliable and invalid. Both are required for sound measurement. In quantitative research, report Cronbach’s alpha for internal consistency reliability and evidence of construct validity for all scales used.
Author
Dr. Rekha Khandelwal, a legal scholar and academic writing expert, is the founder of AspirixWriters. She has extensive experience in guiding students and researchers in writing research papers, theses, and dissertations with clarity and originality. Her work focuses on ethical AI-assisted writing, structured research, and making academic writing simple and effective for learners worldwide.
Author Profile Dr. Rekha Khandelwal | Academic Writer, Legal Technical Writer, AI Expert & Author | AspirixWriters
References
- Creswell, J. W., & Creswell, J. D. (2022). Research Design: Qualitative, Quantitative, and Mixed Methods Approaches (6th ed.). Sage.
- Field, A. (2024). Discovering Statistics Using IBM SPSS Statistics (6th ed.). Sage.
- Cohen, J. (1988). Statistical Power Analysis for the Behavioral Sciences (2nd ed.). Lawrence Erlbaum.
- Shadish, W. R., Cook, T. D., & Campbell, D. T. (2002). Experimental and Quasi-Experimental Designs for Generalized Causal Inference. Houghton Mifflin.
- G*Power: Free power analysis software — gpower.hhu.de
- National Judicial Data Grid (NJDG) — India court statistics. njdg.gov.in
Next— Qualitative Research Design: Choosing the Right Approach
Next in Series
- Complete Guide: Data Analysis and Results Presentation: Complete Guide for Quantitative, Qualitative & Legal Research (2026) (Module 4)
- Complete Guide: Organization and Academic Tone: Complete Guide to Professional Scholarly Writing (2026) (Module 5)
- Complete Guide: Peer Review and Publication: Complete Guide from Submission to Acceptance (2026) (Module 6)
- Complete Guide: AI Tools in Academic Research: Opportunities, Ethics, and Best Practices (2026) (Module 7)
- Complete Guide: Grant Writing and Research Funding: Complete Guide to Finding Money for Your Research (2026) (Module 8)
- Complete Guide: Academic Career Development: Complete Guide to Building Your Professional Life in Research (2026) (Module 9)
- Complete Guide: Research Ethics and the IRB Process: Complete Guide to Doing Research Responsibly (2026) (Module 10)

The Complete Guide to Research Paper Structure: IMRAD Format, Thesis Organization & Academic Writing (2026)
From Concept to Submission: A Complete Guide to Research Paper and Thesis Writing Academic Writing…
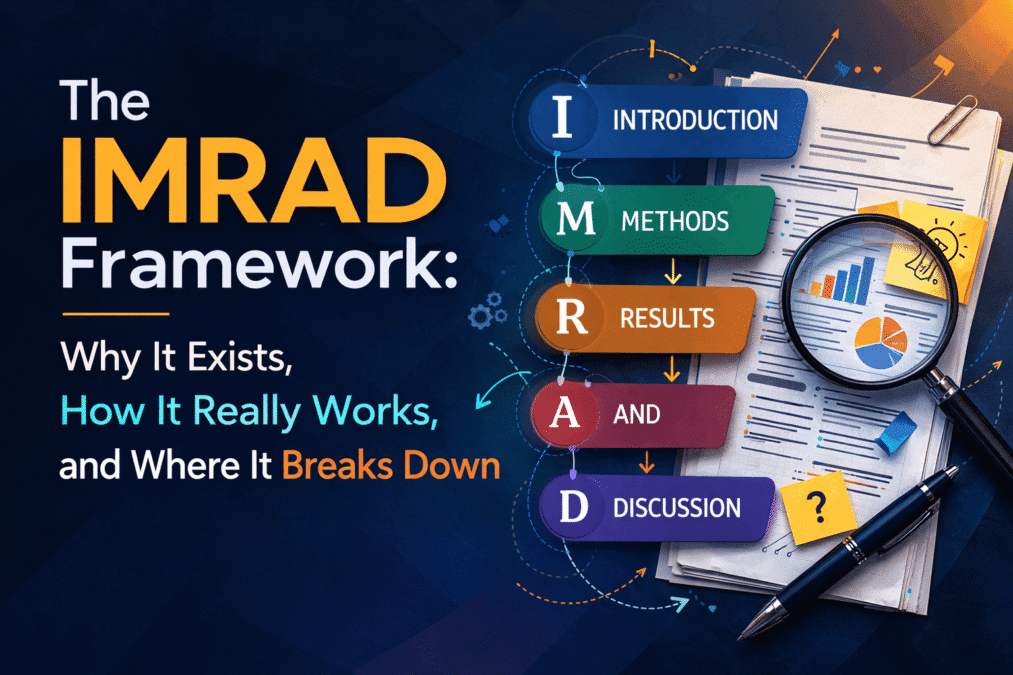
The IMRAD Framework: Why It Exists, How It Really Works, and Where It Breaks Down
The IMRAD Framework Understanding the Structure of Research Papers and Theses – Module 1: From Concept…

How to Write a Research Introduction That Reviewers Cannot Ignore
How to Write a Research Introduction Module 1: Understanding the Structure of Research Papers and…

How to Write a Methods Section That Reviewers Will Trust
How to Write a Methods Section Module 1: Understanding the Structure of Research Papers and…
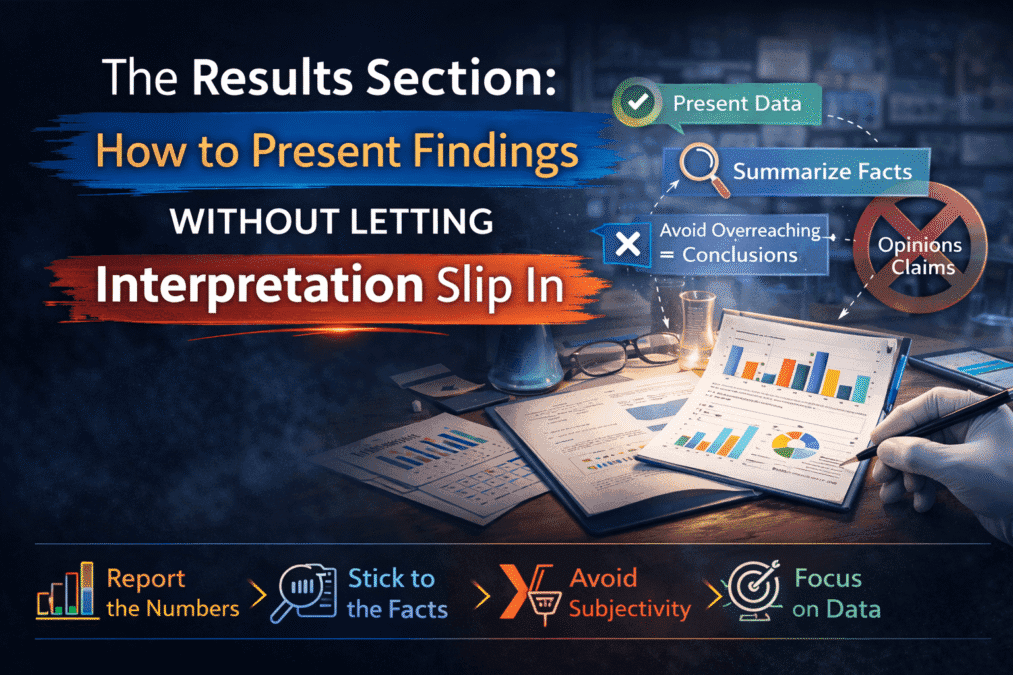
The Results Section: How to Present Findings Without Letting Interpretation Slip In
The Results Section Module 1: Understanding the Structure of Research Papers and Theses From Concept…

The Discussion Section: How to Turn Findings Into Knowledge
The Discussion Section Module 1: Understanding the Structure of Research Papers and Theses From Concept…

Complete Thesis Structure: A Chapter-by-Chapter Guide
Complete Thesis Structure Module 1: Understanding the Structure of Research Papers and Theses From Concept…

10 Structural Mistakes That Get Research Papers Rejected — And How to Fix Every One
10 Structural Mistakes That Get Research Papers Rejected Module 1: Understanding the Structure of Research…

How to Write a Journal Abstract That Gets Your Paper Read
How to Write a Journal Abstract Module 1: Understanding the Structure of Research Papers and…
Systematic Review and PRISMA: How to Conduct and Report a Review That Meets Publication Standards
Systematic Review and PRISMA Module 1: Understanding the Structure of Research Papers and Theses From…

Legal Research Methods: A Complete Guide to Doctrinal, Empirical and Comparative Legal Research
Legal Research Methods Module 1: Understanding the Structure of Research Papers and Theses From Concept…

The Academic Writing Process: Complete Guide from First Draft to Submission (2026)
Module 2, Complete Guide: The Academic Writing Process – from First Draft to Submission From…

How to Start Writing and Keep Going
How to Start Writing Module 2: The Academic Writing Process From Concept to Submission Series …

How to Write Clear Engaging Academic Prose
How to Write Clear Engaging Academic Prose – Module 2: The Academic Writing Process From…
The Revision Process: How to Turn a Draft Into a Submission
The Revision Process Module 2: The Academic Writing Process From Concept to Submission Series | …