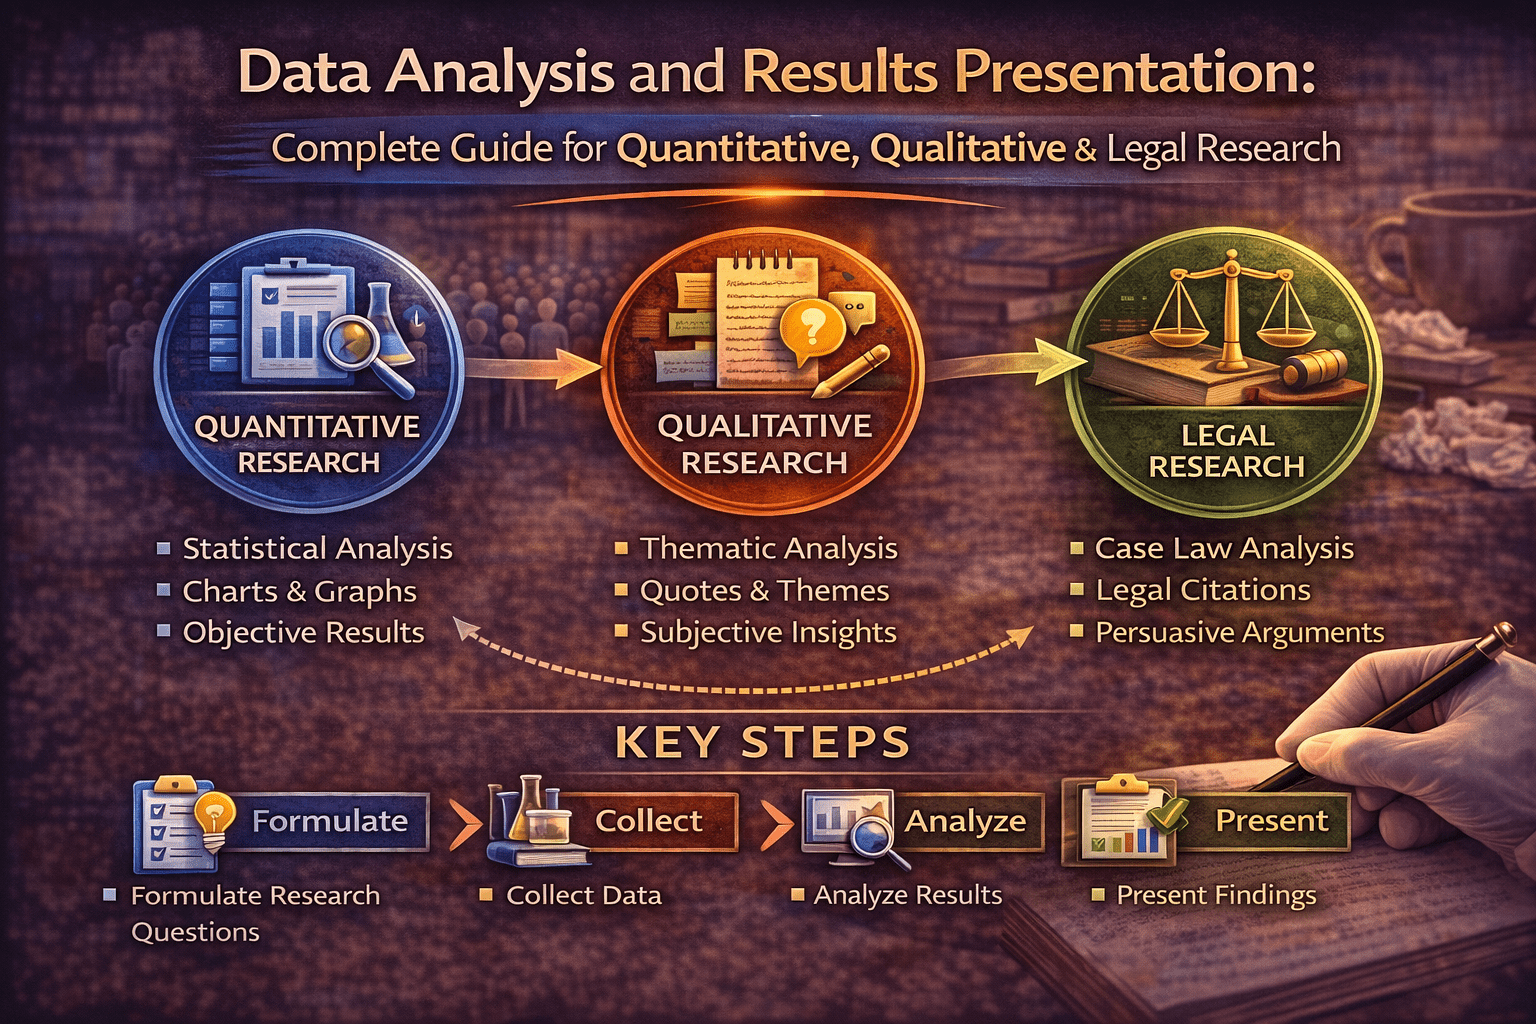
Data Analysis and Results Presentation:

Why Data Analysis Determines Research Credibility
Here’s what separates published research from rejected manuscripts: appropriate, rigorous data analysis. You can collect perfect data, but analyze it wrong and your conclusions are worthless.
Think about it: Your entire dissertation rests on your analysis. Thesis examiners focus heavily on this section. Journal reviewers with statistical expertise will scrutinize every test, every p-value, every interpretation.
This comprehensive guide teaches you how to analyze and present research findings correctly:
- Quantitative analysis (descriptive and inferential statistics)
- Qualitative analysis (coding, themes, interpretation)
- Mixed methods integration
- Results presentation (tables, figures, narrative)
- Case law analysis (for law students)
- Common analysis mistakes to avoid
Whether you’re running regressions, coding interviews, or analyzing judicial decisions, mastering analysis is essential for research success.
Understanding Your Data First
Before analysis, understand what kind of data you have.
Types of Variables
Categorical (Qualitative):
- Nominal: Categories with no order (gender, discipline, yes/no)
- Ordinal: Ordered categories (education level, Likert scales)
Numerical (Quantitative):
- Interval: Equal intervals, no true zero (temperature in Celsius, IQ scores)
- Ratio: Equal intervals with true zero (age, income, test scores)
Why this matters: Variable type determines which statistical tests you can use.
Quantitative Data Analysis
Step 1: Data Cleaning and Preparation
Before analysis:
Check for errors:
- Impossible values (age = 250, Likert scale response = 7 when scale is 1-5)
- Inconsistent entries (sometimes “male,” sometimes “M”)
- Missing data patterns
Handle missing data:
- Listwise deletion: Remove cases with any missing data (if <5% missing)
- Mean imputation: Replace missing values with mean (if missing at random)
- Multiple imputation: Statistical estimation of missing values (advanced)
Code variables appropriately:
- Assign numbers to categories (Male=1, Female=2)
- Create new variables if needed (combine items into scales)
Create codebook: Document what each variable represents and how it’s coded.
Step 2: Descriptive Statistics
Purpose: Summarize and describe your data.
For numerical variables:
- Mean: Average (use when data is normally distributed)
- Median: Middle value (use when data is skewed)
- Standard Deviation (SD): Spread around mean
- Range: Minimum to maximum
Example reporting:
“Participants’ mean age was 18.3 years (SD=0.8, range=17-21).”
For categorical variables:
- Frequencies: Count in each category
- Percentages: Proportion in each category
Example reporting:
“Of 450 participants, 267 (59.3%) were female and 183 (40.7%) were male.”
Step 3: Inferential Statistics
Purpose: Test hypotheses and draw conclusions beyond your sample.
Common Statistical Tests
Comparing Two Groups:
Independent t-test:
- Compare means between two independent groups
- Example: Do intervention students have higher retention than control students?
Reporting:
“Retention intentions were significantly higher in the intervention group (M=4.2, SD=0.7) compared to controls (M=3.6, SD=0.9), t(448)=7.3, p<.001, d=0.74.”
Key components:
- Means and SDs for both groups
- Test statistic (t value)
- Degrees of freedom (df=448)
- p-value (probability)
- Effect size (Cohen’s d=0.74, medium-large effect)
Paired t-test:
- Compare means for same group at two time points
- Example: Pre-test vs. post-test scores
Comparing Three or More Groups:
One-way ANOVA:
- Compare means across 3+ groups
- Example: Do retention rates differ across Arts, Science, and Commerce students?
Reporting:
“Retention rates differed significantly across disciplines, F(2, 447)=12.4, p<.001, η²=.05. Post-hoc tests showed Science students (M=85%) had higher retention than Arts (M=78%) and Commerce (M=79%).”
Testing Relationships:
Correlation:
- Measure strength and direction of relationship between two variables
- Pearson’s r for linear relationships (-1 to +1)
Example:
“Peer support was positively correlated with retention intentions, r(448)=.54, p<.001, indicating that students with stronger peer networks had higher intentions to persist.”
Multiple Regression:
- Predict outcome variable from multiple predictors
- Shows which variables matter most
Example:
“Multiple regression revealed that peer support (β=.38, p<.001), academic self-efficacy (β=.26, p<.01), and financial security (β=.18, p<.05) significantly predicted retention intentions, R²=.42, F(3,446)=108.2, p<.001.”
Testing Independence:
Chi-square:
- Test relationship between two categorical variables
- Example: Is retention (stayed/left) related to intervention (yes/no)?
Reporting:
“Retention rates differed significantly by condition, χ²(1, N=450)=8.92, p=.003. Students in the intervention group showed 82% retention compared to 71% in the control group.”
Understanding P-Values and Significance
p-value: Probability of getting your results if the null hypothesis is true.
Convention:
- p<.05: Statistically significant (less than 5% chance results are due to random chance)
- p<.01: Highly significant
- p<.001: Very highly significant
Critical: p-value alone doesn’t tell you if effect is meaningful. Always report effect sizes.
Effect Sizes
Why they matter: Statistical significance tells you IF there’s an effect. Effect size tells you HOW BIG.
With large samples, tiny differences can be “significant” but meaningless.
Cohen’s d (for t-tests):
- 0.2 = small effect
- 0.5 = medium effect
- 0.8 = large effect
Eta-squared (η²) for ANOVA:
- .01 = small
- .06 = medium
- .14 = large
R-squared (R²) for regression:
- Proportion of variance explained
- .10 = 10% of variance explained
Software Options
SPSS:
- User-friendly, point-and-click interface
- Common in social sciences, education, psychology
- Expensive but many universities provide licenses
R:
- Free, open-source
- Powerful, flexible
- Steeper learning curve
- Excellent for advanced statistics
Stata:
- Common in economics, public health
- Good for panel data and econometrics
Excel:
- Basic statistics only
- NOT recommended for serious research
Qualitative Data Analysis
Step 1: Familiarize Yourself with Data
Before coding:
- Read all transcripts or field notes thoroughly
- Make initial notes and impressions
- Identify potential patterns
Step 2: Coding Data
Coding: Assigning labels to segments of data.
Open coding:
- Read through data line-by-line
- Assign codes to meaningful segments
- Be descriptive (codes = short labels summarizing content)
Example:
Transcript excerpt: “My mentor really helped me when I was struggling with chemistry. I would have quit without her.”
Codes: [academic support], [peer mentoring], [persistence factor]
Develop codebook:
- Code name
- Definition
- When to use
- When NOT to use
- Example
Step 3: Identify Themes
Themes: Patterns across codes that capture important aspects of data.
Process:
- Group related codes together
- Identify overarching themes
- Define each theme clearly
- Find representative quotes
Example analysis:
Theme 1: Peer Mentors as Safety Nets
- Definition: Mentors provide critical support during academic or personal crises
- Codes included: academic support, emotional support, crisis intervention
- Prevalence: 27 of 30 interviews
Representative quote:
“When I was failing math and wanted to drop out, my mentor spent hours helping me every night. Without her, I wouldn’t be here” (Participant 7, female, Science).
Step 4: Ensure Trustworthiness
Strategies:
Member checking:
- Share findings with participants
- Ask if your interpretation resonates
- Revise based on feedback
Triangulation:
- Multiple data sources (interviews + observations + documents)
- Multiple researchers coding independently
- Compare interpretations
Thick description:
- Provide rich, detailed descriptions
- Enough context for readers to assess transferability
Audit trail:
- Document your analytical decisions
- Keep record of code development
- Show your reasoning process
Qualitative Software
NVivo:
- Industry standard
- Organize transcripts, code data, query patterns
- Expensive but powerful
ATLAS.ti:
- Similar to NVivo
- Strong for theory building
MAXQDA:
- User-friendly
- Good for mixed methods
Free options:
- Dedoose (cloud-based, affordable)
- Manual coding (highlight printouts, use spreadsheets)
Important: Software helps organize, but YOU do the analysis. Software doesn’t interpret meaning—you do.
Mixed Methods Analysis
Integration Strategies
Merge:
- Combine quantitative and qualitative databases
- Compare findings side-by-side
Example table:
| Finding | Quantitative Evidence | Qualitative Evidence |
| Peer support predicts retention | r=.54, p<.001 | 27/30 participants cited mentor support as critical |
Connect:
- Use quantitative results to inform qualitative sampling
- Example: Survey identifies high vs. low retainers → Interview both groups to understand why
Embed:
- One method supports the other
- Example: Brief interviews explain unexpected quantitative findings
Presenting Results Effectively
Narrative Results Section
Structure:
1. Restate purpose (1 sentence)
“This study examined the impact of peer mentoring on first-year retention.”
2. Present findings systematically
- Organize by research question or hypothesis
- Quantitative → qualitative → integration (for mixed methods)
3. Use clear topic sentences
“Hypothesis 1 predicted that students receiving peer mentoring would show higher retention than controls. This hypothesis was supported.”
4. Report statistics completely
- Always include: test statistic, degrees of freedom, p-value, effect size
- Example: t(448)=7.3, p<.001, d=0.74
5. Refer to tables/figures
“As shown in Table 1, retention rates were consistently higher in the intervention group across all three colleges.”
Creating Effective Tables
Good table characteristics:
- Clear, descriptive title
- Column headers well-labeled
- Numbers aligned properly
- Include sample sizes (n)
- Note statistical significance (* p<.05, ** p<.01)
Example table:
Table 1
Retention Rates by Condition and College
| College | Intervention n (%) | Control n (%) | χ² | p |
| College A | 82 (83%) | 35 (70%) | 4.12 | .042* |
| College B | 86 (86%) | 39 (78%) | 2.34 | .126 |
| College C | 78 (78%) | 33 (66%) | 3.45 | .063 |
| Total | 246 (82%) | 107 (71%) | 8.92 | .003 |
Note. n = sample size. * p<.05, ** p<.01.
Creating Effective Figures
When to use:
- Bar charts: Compare categories
- Line graphs: Show trends over time
- Scatter plots: Show relationships
- Box plots: Show distributions
Figure requirements:
- Descriptive caption
- Labeled axes with units
- Legend if needed
- High resolution
- Black and white friendly (for print)
Common Analysis Mistakes
Mistake 1: Ignoring Assumptions
Problem: Using tests without checking if data meets requirements.
Example: Using t-test when data is severely skewed (violates normality assumption)
Solution: Check assumptions first. Use non-parametric alternatives if assumptions violated.
Mistake 2: P-Hacking
Problem: Running many tests until finding p<.05, only reporting significant ones.
This is misconduct. It inflates false positives.
Solution: Pre-register hypotheses. Report all tests run, not just significant ones.
Mistake 3: Confusing Correlation with Causation
Problem: Finding correlation, claiming causation.
Wrong – “Peer support causes retention” (from correlational data)
Right – “Peer support is associated with retention” OR “Peer support predicts retention”
Only experiments can establish causation.
Mistake 4: Cherry-Picking Qualitative Quotes
Problem: Only presenting quotes that support your interpretation.
Solution: Present data representing the full range of responses. Note exceptions and contradictions.
Mistake 5: Over-Interpreting Small Samples
Problem: Claiming “students feel…” based on 5 interviews.
Solution: Qualify claims appropriately. “These 5 participants described…” or “In this small sample…”
Writing the Results Section
Results vs. Discussion
Results section:
- Right –What you found
- Wrong –What it means (that’s Discussion)
Example:
Results (correct):
“Retention rates were significantly higher in the intervention group (82%) compared to controls (71%), χ²(1, N=450)=8.92, p=.003.”
NOT in Results:
“This shows that peer mentoring is an effective retention strategy that colleges should implement.” (This interpretation belongs in Discussion)
Results Checklist
Before submitting, verify:
- [ ] All research questions addressed
- [ ] Statistical tests reported completely
- [ ] Tables/figures referenced in text
- [ ] No interpretation (save for Discussion)
- [ ] Sample sizes clear
- [ ] No contradictions with methods section
FOR LAW STUDENTS: Analyzing and Presenting Legal Data
Legal research involves analyzing different types of “data” than other disciplines—primarily case law, statutes, and sometimes empirical legal data.
Doctrinal Legal Analysis
Analyzing Case Law
Case analysis process:
1. Identify relevant cases
- Supreme Court > High Courts > subordinate courts
- Binding precedents > persuasive precedents
- Landmark cases > routine applications
2. For each case, extract:
Facts (briefly):
Puttaswamy v. Union of India involved challenges to Aadhaar program’s constitutionality, specifically regarding mandatory linking to services and privacy implications.
Legal issues:
Whether right to privacy is protected fundamental right under Article 21; whether Aadhaar scheme violates this right.
Holding (ratio decidendi):
Nine-judge bench unanimously held right to privacy is intrinsic to life and liberty under Article 21. Privacy includes informational privacy and right to control personal data.
Reasoning:
Court traced evolution of Article 21, examined comparative jurisprudence (US, Europe), held that privacy necessary for dignity and autonomy protected by Constitution.
Significance:
Overruled previous decisions denying fundamental status to privacy; established constitutional foundation for data protection; influenced subsequent cases on surveillance, data protection.
3. Organize case analysis
Chronological approach:
- Show evolution of doctrine over time
- Trace development of principles
Thematic approach:
- Organize by legal issues
- Compare how courts addressed similar questions
Example organization:
Chapter 3: Judicial Interpretation of Article 21 Privacy
Section 3.1: Pre-Puttaswamy: Privacy as Common Law Right (1950-2015)
- Kharak Singh (1964): Majority denied privacy as fundamental right
- Govind (1975): Recognized limited privacy protection
- Pattern: Judicial reluctance to expand Article 21
Section 3.2: Puttaswamy: Constitutional Privacy (2017)
- Facts and context
- Nine-judge bench’s reasoning
- Three-part framework established
- Significance for subsequent cases
Section 3.3: Post-Puttaswamy: Applying Privacy Framework (2018-2025)
- Data protection cases
- Surveillance cases
- How courts apply Puttaswamy principles
Analyzing Statutory Provisions
Process:
1. Plain meaning analysis
Section 43A of IT Act, 2000: “body corporate” shall be liable for compensation for negligence in implementing reasonable security practices…
Plain meaning: Companies must secure personal data or face liability.
2. Legislative intent
- Parliamentary debates
- Statement of objects and reasons
- Committee reports
3. Judicial interpretation
- How have courts interpreted this provision?
- Any ambiguities clarified?
4. Practical application
- How does this operate in practice?
- Enforcement mechanisms?
- Gaps or problems?
Presenting Doctrinal Analysis
Results section in legal thesis = Analysis chapters
Structure:
Descriptive analysis:
“Analysis of 15 Supreme Court decisions from 2018-2024 reveals three distinct approaches to balancing privacy and surveillance…”
Then present each approach:
Approach 1: Strict Scrutiny (5 cases)
- Case examples
- Reasoning patterns
- Outcomes
Approach 2: Balancing Test (7 cases)
- Case examples
- How courts balance interests
- Outcomes
Approach 3: Deference to Executive (3 cases)
- Case examples
- Rationale for deference
- Outcomes
Synthesis:
“While courts predominantly employ balancing tests, no single framework has emerged. Inconsistencies appear in how courts weigh competing interests…”
Empirical Socio-Legal Analysis
Quantitative Legal Research
Examples:
- Analyze sentencing data for patterns
- Survey lawyers about case outcomes
- Code judicial decisions for variables, analyze statistically
Process:
1. Create dataset from legal materials
Example: Analyzing Supreme Court privacy decisions (2017-2025)
Variables to code:
- Case name, year, bench size
- Legal issue (categorical)
- Plaintiff type (individual, organization, government)
- Outcome (plaintiff won/lost)
- Reasoning type (rights-based, balancing, etc.)
- Citations to Puttaswamy (yes/no)
2. Analyze patterns
Descriptive:
“Of 47 privacy cases decided 2017-2025, plaintiffs prevailed in 28 (59.6%). Individual plaintiffs won more frequently (64%) than organizational plaintiffs (52%).”
Inferential:
“Logistic regression revealed that cases citing Puttaswamy were significantly more likely to favor plaintiffs (OR=3.4, p=.008), controlling for issue type and plaintiff characteristics.”
3. Present findings
Use tables showing patterns:
Table 2
Supreme Court Privacy Cases: Outcomes by Issue Type (2017-2025)
| Issue Type | Plaintiff Won | Plaintiff Lost | % Won |
| Data collection | 12 | 5 | 70.6% |
| Surveillance | 8 | 7 | 53.3% |
| Data breach | 8 | 7 | 53.3% |
| Total | 28 | 19 | 59.6% |
Qualitative Legal Research
Examples:
- Interview judges about decision-making
- Observe court proceedings
- Analyze legal discourse
Analysis process same as other qualitative research:
- Code transcripts
- Identify themes
- Present with supporting quotes
Special consideration: Legal professionals may be identifiable even with pseudonyms. Extra care needed for confidentiality.
Presenting Legal Research Results
For Doctrinal Research
NOT like scientific results section.
Doctrinal analysis = your main content chapters, not separate “results.”
Structure:
- Present case-by-case analysis
- Synthesize principles
- Identify patterns, contradictions, gaps
- Build argument throughout
Example:
NOT:
“Results showed that courts used three approaches.” (Too scientific)
INSTEAD:
“Examination of Supreme Court jurisprudence reveals three distinct approaches to privacy-surveillance balance. The first, exemplified by X v. Y (2019), employs strict scrutiny…”
For Empirical Legal Research
DO include separate Results section (like other empirical research)
Quantitative legal research results:
“Analysis of 200 High Court bail decisions revealed significant disparities. Defendants represented by counsel received bail 67% of the time, compared to 34% for unrepresented defendants, χ²(1, N=200)=21.8, p<.001.”
Qualitative legal research results:
“Interviews with 25 legal aid attorneys revealed three major themes regarding access barriers: (1) geographic inaccessibility…”
Common Legal Analysis Mistakes
Mistake 1: Case Description Without Analysis
Wrong – Just summarizing what courts decided
Right – Analyzing what principles emerge, why courts reasoned as they did, what it means
Mistake 2: Selective Case Selection
Wrong – Only citing cases supporting your argument
Right – Comprehensive analysis including contrary authority, explaining why it doesn’t apply or is wrongly decided
Mistake 3: Insufficient Citation
Wrong – Claiming courts hold X without citation
Right – Every legal claim must cite to specific case, statute, or authority
Mistake 4: Confusing Dicta with Holding
Wrong –Treating judges’ passing comments as binding law
Right – Distinguishing ratio decidendi (binding) from obiter dicta (non-binding)
Tools for Legal Analysis
Qualitative Analysis of Cases
NVivo or ATLAS.ti:
- Import case PDFs
- Code judicial reasoning
- Identify patterns across cases
Spreadsheets:
- Track cases with variables
- Sort/filter by characteristics
- Simple but effective
Quantitative Analysis of Legal Data
SPSS, R, Stata:
- Same as other research
- Useful for large-scale court data analysis
Excel:
- Sufficient for basic frequencies
- Not for complex statistics
Case Management
Reference managers (Zotero, Mendeley):
- Store cases
- Generate citations
- Organize by theme
Key Takeaways for Law Students
- Case analysis requires extracting principles, not just summarizing facts
- Doctrinal analysis is analytical throughout, not separate “results”
- Empirical legal research follows standard quantitative/qualitative methods
- Organize chronologically or thematically, whichever serves analysis better
- Present patterns, evolution, contradictions in judicial reasoning
- Use tables/charts for empirical legal data like other research
- Distinguish holding from dicta, binding from persuasive authority
Conclusion
Data analysis transforms raw information into meaningful findings. Whether analyzing numbers, interview transcripts, or judicial decisions, systematic analysis is essential.
For quantitative researchers: Choose appropriate statistical tests, check assumptions, report completely, interpret cautiously.
For qualitative researchers: Code systematically, identify themes carefully, ensure trustworthiness, present richly.
For law students: Analyze case law to identify principles, trace evolution, synthesize doctrine; use empirical methods for socio-legal research.
For everyone: Analysis quality determines research credibility. Master these methods—your research depends on it.
References
- Field, A. (2024). Discovering Statistics Using IBM SPSS (6th ed.). Sage Publications.
- Saldaña, J. (2021). The Coding Manual for Qualitative Researchers (4th ed.). Sage Publications.
- Braun, V., & Clarke, V. (2022). Thematic Analysis: A Practical Guide (2nd ed.). Sage Publications.
- Creswell, J. W., & Creswell, J. D. (2022). Research Design: Qualitative, Quantitative, and Mixed Methods Approaches (6th ed.). Sage.
Part of: Complete Research Writing Guide Series
Next in Series:
- Organization & Tone: Professional Academic Writing
- For Law Students: Legal Writing Conventions

The Complete Guide to Research Paper Structure: IMRAD Format, Thesis Organization & Academic Writing (2026)
From Concept to Submission: A Complete Guide to Research Paper and Thesis Writing Module 1:…
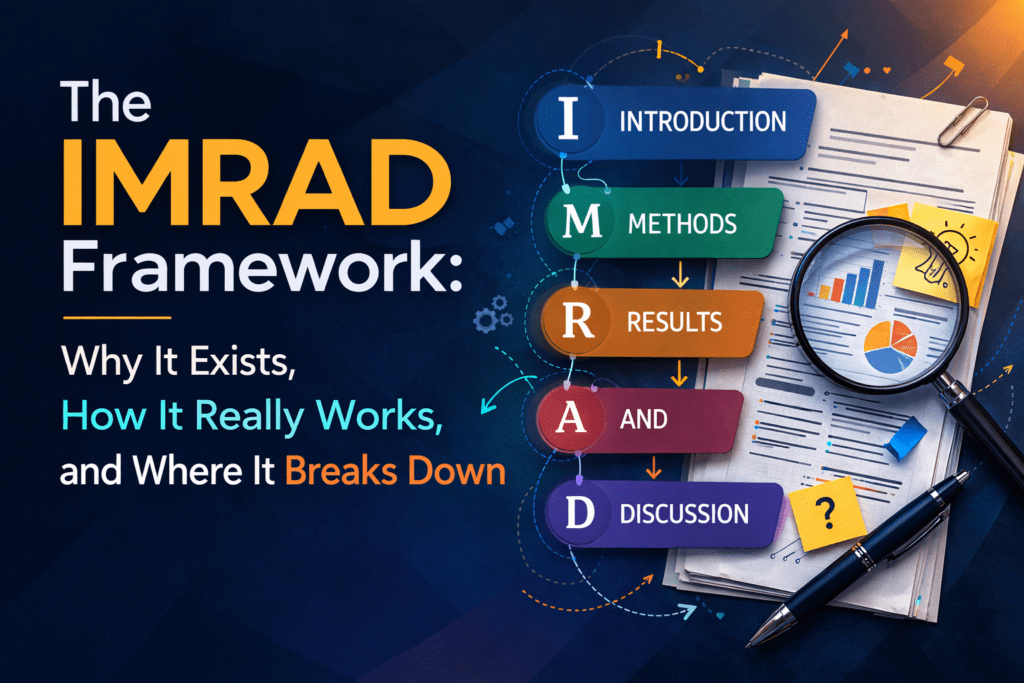
The IMRAD Framework: Why It Exists, How It Really Works, and Where It Breaks Down
Cluster Post 1 | Module 1: Understanding the Structure of Research Papers and Theses From…

How to Write a Research Introduction That Reviewers Cannot Ignore
Cluster Post 2 | Module 1: Understanding the Structure of Research Papers and Theses From…

How to Write a Methods Section That Reviewers Will Trust
Cluster Post 3 | Module 1: Understanding the Structure of Research Papers and Theses From…
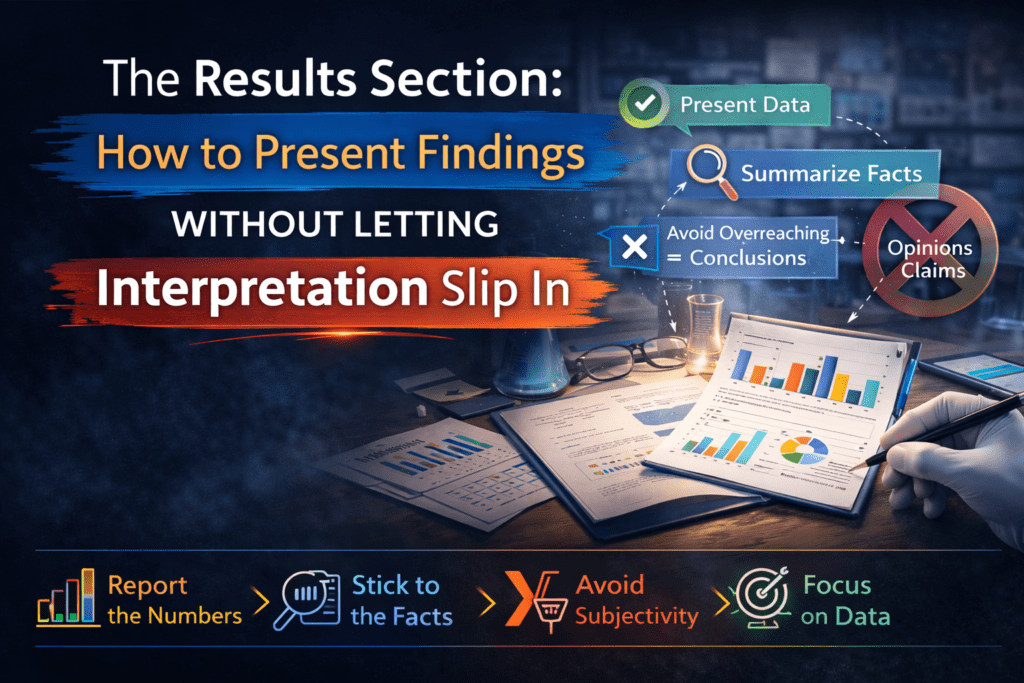
The Results Section: How to Present Findings Without Letting Interpretation Slip In
Cluster Post 4 | Module 1: Understanding the Structure of Research Papers and Theses From…

The Discussion Section: How to Turn Findings Into Knowledge
Cluster Post 5 | Module 1: Understanding the Structure of Research Papers and Theses From…

Complete Thesis Structure: A Chapter-by-Chapter Guide
Cluster Post 6 | Module 1: Understanding the Structure of Research Papers and Theses From…

10 Structural Mistakes That Get Research Papers Rejected — And How to Fix Every One
Cluster Post 7 | Module 1: Understanding the Structure of Research Papers and Theses From…

The Academic Writing Process: Complete Guide from First Draft to Submission (2026)
From Concept to Submission: A Complete Guide to Research Paper and Thesis Writing Module 2,…

How to Start Writing — and Keep Going
Cluster Post 1 | Module 2: The Academic Writing Process From Concept to Submission Series …

How to Write Clear Engaging Academic Prose
Cluster Post 2 | Module 2: The Academic Writing Process From Concept to Submission Series …

The Revision Process: How to Turn a Draft Into a Submission
Cluster Post 3 | Module 2: The Academic Writing Process From Concept to Submission Series …
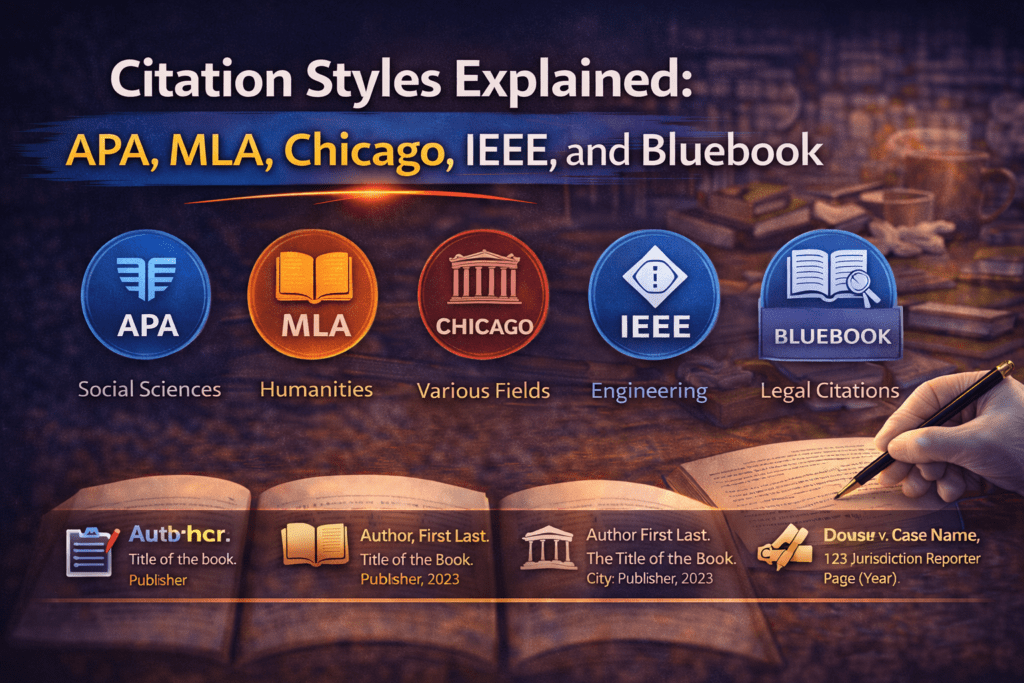
Citation Styles Explained: APA, MLA, Chicago, IEEE, and Bluebook
Cluster Post 4 | Module 2: The Academic Writing Process From Concept to Submission Series …

Reference Management: Zotero and Mendeley from Setup to Submission
Cluster Post 5 | Module 2: The Academic Writing Process From Concept to Submission Series …
Research Methodologies: Complete Guide to Quantitative, Qualitative, Mixed Methods & Legal Research (2026)
Why Methodology Determines Research Quality Here’s what thesis examiners focus on first: your methodology section…

Research Paradigms: Why Your Philosophical Stance Shapes Everything
Cluster Post 1 | Module 3: Research Methodologies From Concept to Submission Series | 2026 ←…
Quantitative Research Design: From Hypothesis to Valid Results
Cluster Post 2 | Module 3: Research Methodologies From Concept to Submission Series | 2026…
Qualitative Research Design: Choosing the Right Approach
Cluster Post 3 | Module 3: Research Methodologies From Concept to Submission Series | 2026…
Qualitative Data Collection and Analysis: Interviews, Coding, and Trustworthiness
Cluster Post 4 | Module 3: Research Methodologies From Concept to Submission Series | 2026…
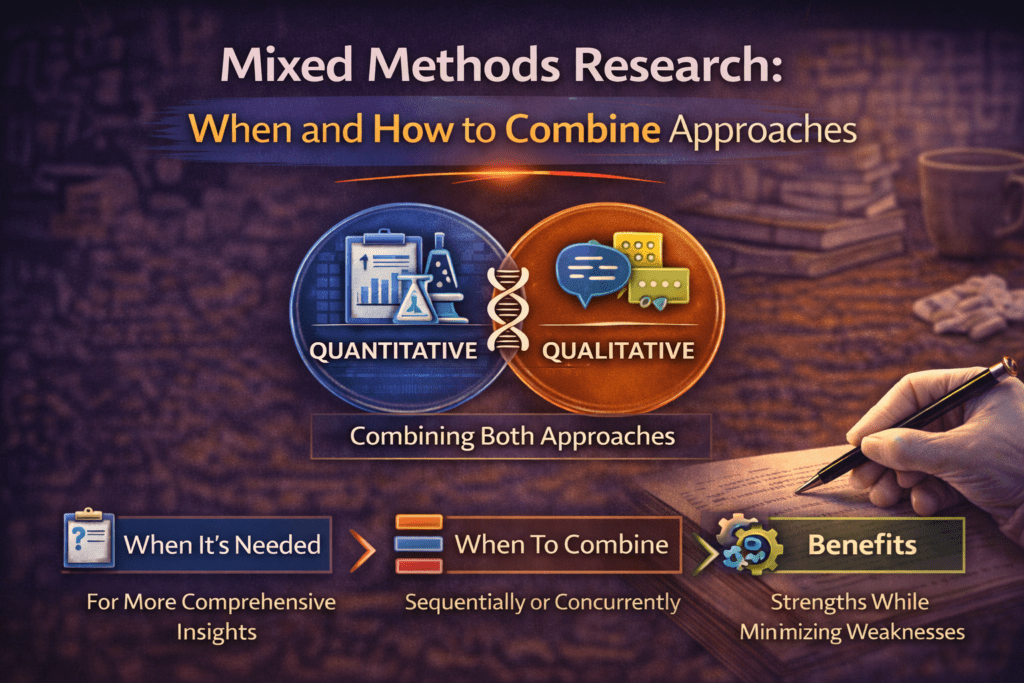
Mixed Methods Research: When and How to Combine Approaches
Cluster Post 5 | Module 3: Research Methodologies From Concept to Submission Series | 2026…
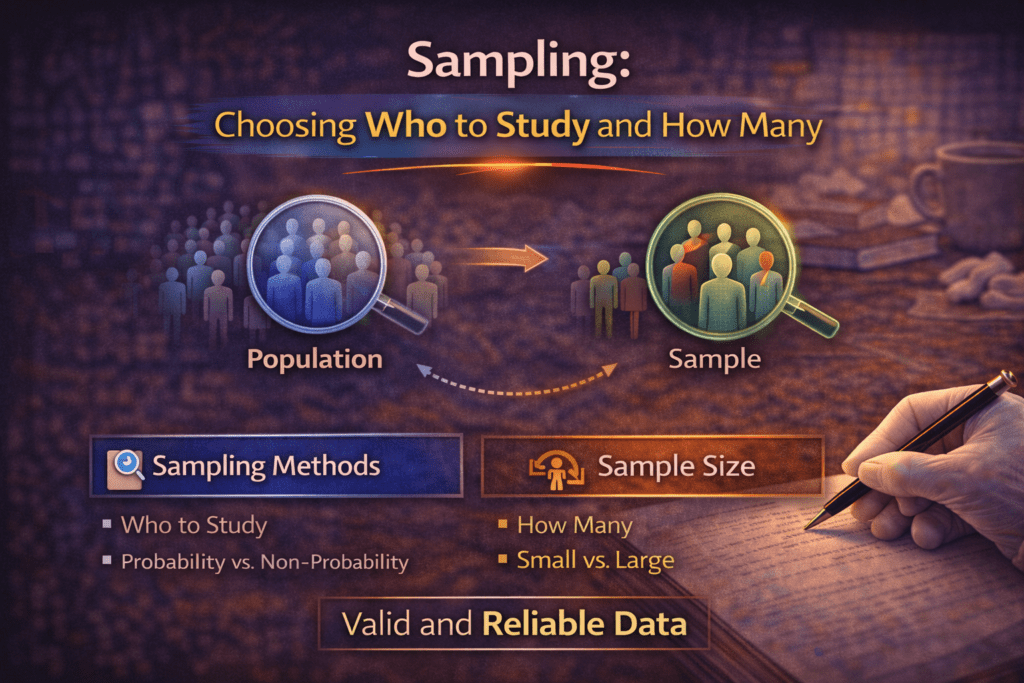
Sampling: Choosing Who to Study and How Many
Cluster Post 6 | Module 3: Research Methodologies From Concept to Submission Series | 2026…
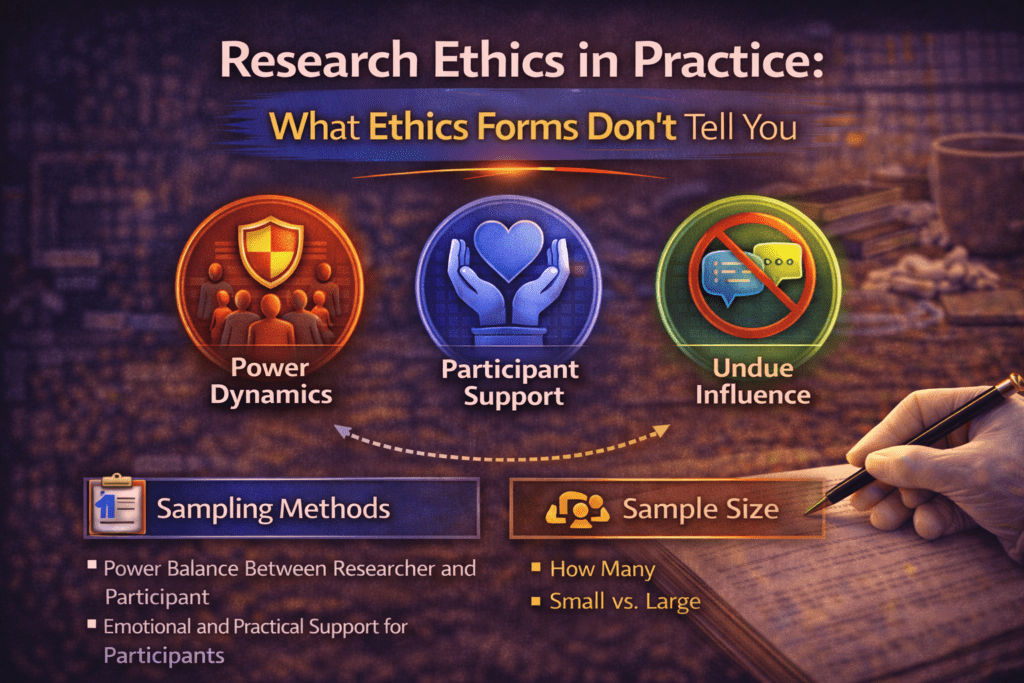
Research Ethics in Practice: What Ethics Forms Don’t Tell You
Cluster Post 7 | Module 3: Research Methodologies From Concept to Submission Series | 2026…
Data Analysis and Results Presentation: Complete Guide for Quantitative, Qualitative & Legal Research (2026)
Data Analysis and Results Presentation: Why Data Analysis Determines Research Credibility Here’s what separates published…
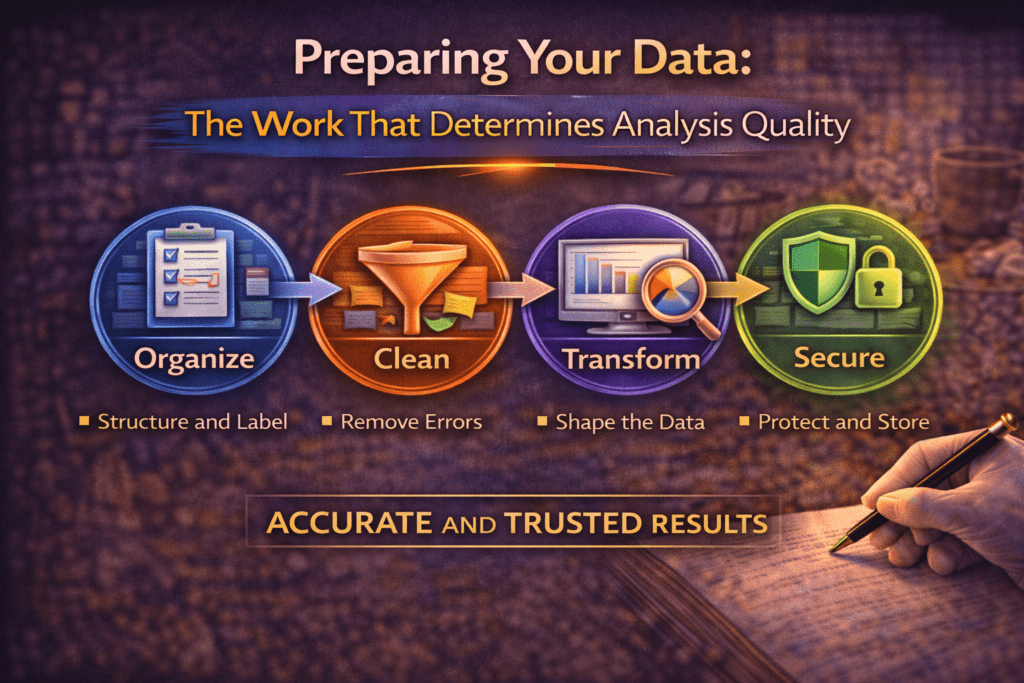
Preparing Your Data: The Work That Determines Analysis Quality
Cluster Post 1 | Module 4: Data Analysis and Presenting Results From Concept to Submission…
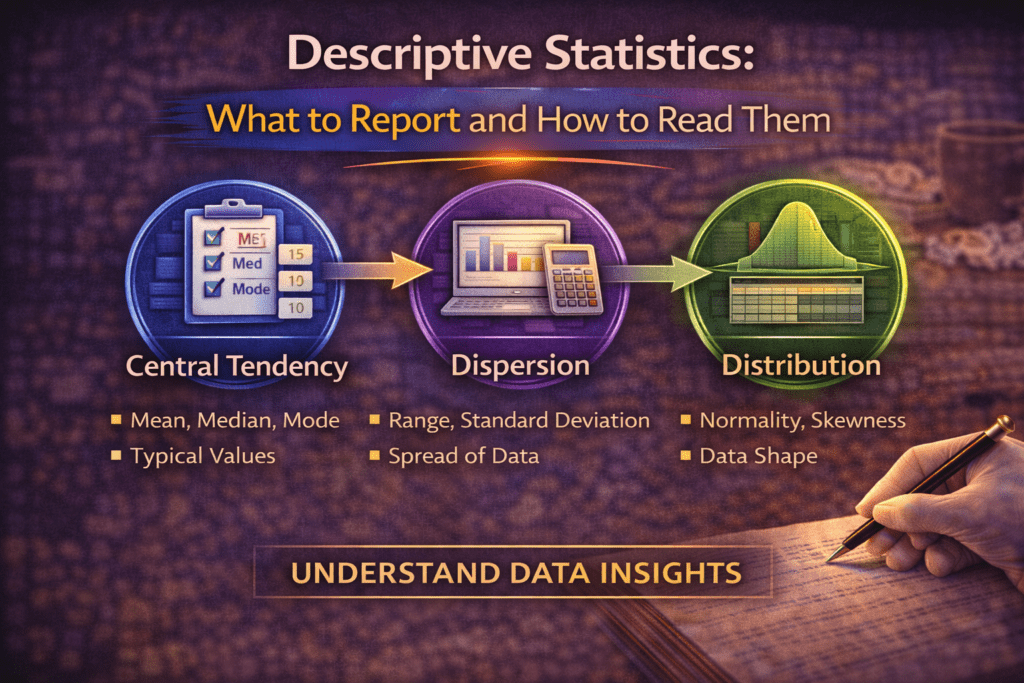
Descriptive Statistics: What to Report and How to Read Them
Cluster Post 2 | Module 4: Data Analysis and Presenting Results From Concept to Submission…
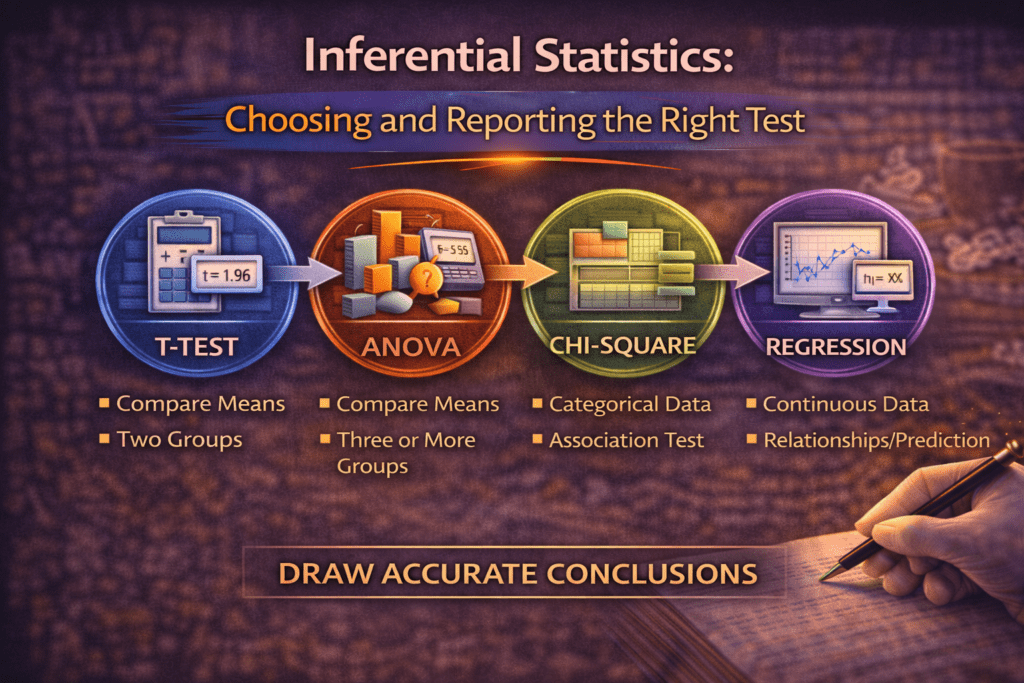
Inferential Statistics: Choosing and Reporting the Right Test
Cluster Post 3 | Module 4: Data Analysis and Presenting Results From Concept to Submission…
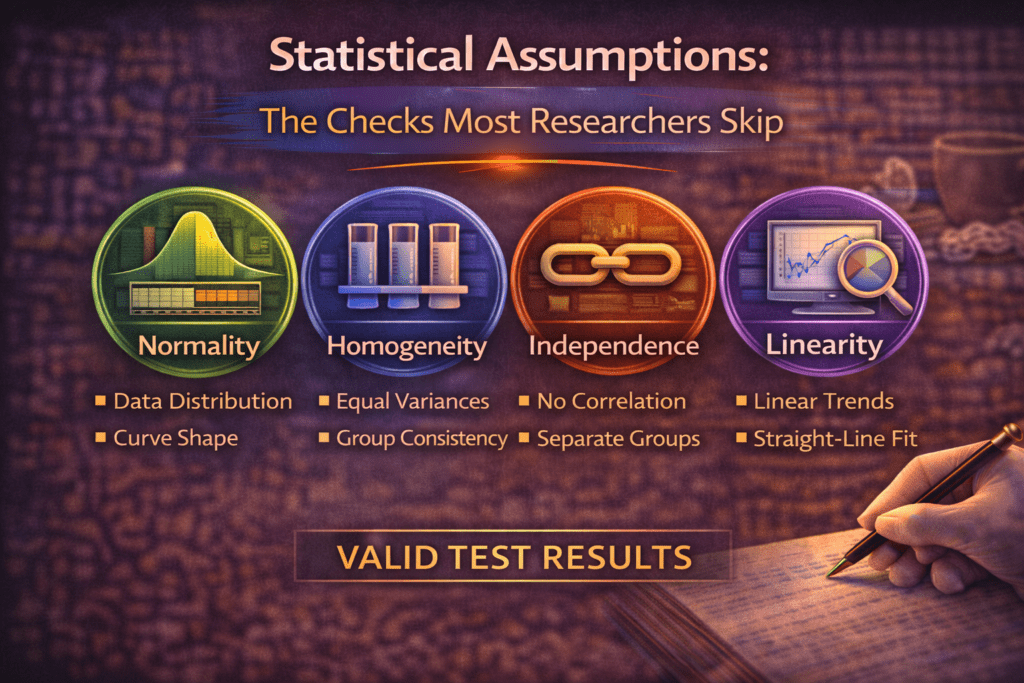
Statistical Assumptions: The Checks Most Researchers Skip
Cluster Post 4 | Module 4: Data Analysis and Presenting Results From Concept to Submission…
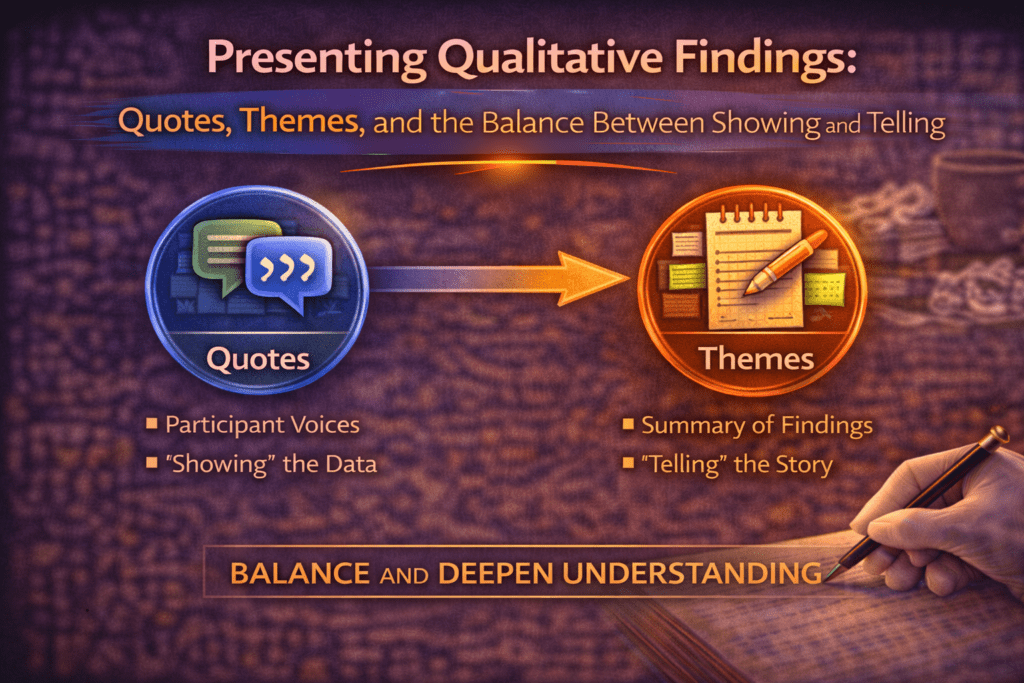
Presenting Qualitative Findings: Quotes, Themes, and the Balance Between Showing and Telling
Cluster Post 5 | Module 4: Data Analysis and Presenting Results From Concept to Submission…
Writing the Results Section: Separating Findings from Interpretation
Cluster Post 6 | Module 4: Data Analysis and Presenting Results From Concept to Submission…

Organization and Academic Tone: Complete Guide to Professional Scholarly Writing (2026)
Why Organization and Academic Tone Matter More Than You Think Here’s what thesis examiners notice…