Cluster Post 1 | Module 4: Data Analysis and Presenting Results
From Concept to Submission Series | 2026

Preparing Your Data: The Work That Determines Analysis Quality
The module overview mentions data preparation briefly before moving to analysis techniques. This post goes deeper: how to build a codebook that prevents analysis errors six months later, the specific cleaning checks that every quantitative dataset needs before a single statistical test is run, how to handle missing data without introducing bias, and how to organise qualitative data so that analysis is systematic rather than impressionistic.
Why Data Preparation Is Not a Preliminary Step
Most research methods courses present data preparation as the unglamorous preamble to the real work of analysis. Run your cleaning checks, set up your files, then do the analysis. This framing underestimates how consequential preparation decisions are.
Every analysis you run is only as trustworthy as the data it runs on. A regression model built on data with uncorrected entry errors will produce precise-looking but inaccurate estimates. A thematic analysis conducted on poorly organised transcripts will miss patterns that are present in the data. The most sophisticated statistical technique cannot compensate for corrupted input data. Getting preparation right is not a preliminary — it is a precondition.
Preparation errors are also disproportionately difficult to catch after analysis. A data entry error that produced one impossible value — an age of 300 — is easy to fix if caught before analysis. If caught after analysis, you need to know whether that error affected your results: re-run the descriptives, check whether the outlier was influential in your regressions, decide whether the published results need correction. The same hour spent on cleaning before analysis saves many hours after it.
Building a Quantitative Codebook
A codebook is a document that defines every variable in your dataset: what it represents, how it was measured, how it is coded in the spreadsheet, and any transformations applied. It is the bridge between your data collection instrument and your analysis files, and it is essential for research that will be written up months after data was collected.
The codebook must be created before data entry begins, not after. Deciding how to code variables after you have already collected data produces inconsistency. If some respondents wrote “Male” and others wrote “M” and you enter both without standardising, your software will treat them as two different categories.
What every codebook entry needs
| Codebook field | What to include |
| Variable name | Short, consistent label used in the spreadsheet (e.g., gender, age, Q3_anxiety). No spaces; use underscores. |
| Variable label | Full description of what the variable measures (e.g., ‘Participant self-reported gender identity’) |
| Variable type | Nominal, ordinal, interval, or ratio — this determines which statistics are appropriate |
| Response options and codes | Every possible value and its numeric code (e.g., 1 = Male, 2 = Female, 3 = Non-binary, 4 = Prefer not to say, 99 = Missing) |
| Source | Which question on which instrument this variable came from (e.g., ‘Demographic questionnaire, Q2’) |
| Notes | Any transformations applied, reverse-scoring instructions, or special cases to be aware of |
Separate missing data codes from valid response codes. If your scale runs from 1 to 5, do not code a missing response as 0 — it will be treated as a valid data point lower than 1, distorting means and correlations. Use a clearly out-of-range code (99 or -9) and tell your software to treat it as missing before analysis.
Reverse-scored items: the most common codebook omission
Many psychological scales include reverse-scored items — questions where a high score indicates the opposite of a high score on other items. On an anxiety scale, most items might be scored so that higher = more anxious, but an item like “I feel calm and in control” requires that the scoring be reversed (5 becomes 1, 4 becomes 2, and so on) before computing the scale total.
Reverse-scoring failures are among the most common analysis errors in quantitative social science research. They produce scale scores that are internally inconsistent, which suppresses the reliability of the measure and attenuates correlations with other variables. Every codebook entry for a scale must identify which items are reverse-scored and confirm that reversal was applied before computing composite scores.
Data Cleaning: The Specific Checks
Data cleaning is not reading through the spreadsheet and hoping you notice problems. It is a systematic series of checks, each targeting a specific category of error. The following sequence applies to any quantitative dataset.
Check 1: Range checks
For every variable, verify that all values fall within the possible range. A participant who scores 8 on a scale that runs from 1 to 7 has been incorrectly entered. An age of 5 in a study of university students is impossible. A completion time of 0 seconds means something went wrong.
Run frequency distributions and descriptive statistics for every variable as your first analysis step. Sort variables and look at the minimum and maximum values. Flag anything outside the legitimate range and return to the original data source — the survey response, the interview recording, the observation form — to determine the correct value.
Check 2: Logical consistency checks
Some values are individually possible but logically inconsistent with other values in the same row. A participant who reports being in their third year of study but who has been at the institution for six months. A student who reports having a PhD as their highest qualification in a study of first-year undergraduates. A respondent who skipped question 4 (“Are you currently employed?”) but answered questions 5 through 9, which were conditional on a “yes” to question 4.
Example consistency check: In a study of peer mentoring, cross-check the variable ‘has_a_mentor’ (1 = yes, 0 = no) against ‘mentor_contact_frequency’ (number of times per month). Any row where has_a_mentor = 0 but mentor_contact_frequency > 0 is internally inconsistent and requires investigation.
Check 3: Duplicate case checks
In online surveys, participants sometimes submit responses multiple times — accidentally (refreshed the page) or deliberately (completed the survey twice to receive incentives). Check for duplicate participant IDs, and for studies without participant IDs, check for rows that are identical or near-identical across multiple variables simultaneously.
Your decision rule for duplicates must be stated in your methodology: keep the first response, keep the most complete response, keep neither, or contact the participant to determine which is valid. Whatever rule you apply, apply it consistently and document it.
Check 4: Missing data analysis
Missing data is not simply absent information — it is a potential source of bias. Whether missing data threatens your conclusions depends on why data is missing: the missing data mechanism.
- Missing completely at random (MCAR): The probability of data being missing is unrelated to any variable in the study. Dropping cases with missing data does not introduce bias, though it reduces sample size.
- Missing at random (MAR): The probability of missing data depends on other observed variables but not on the missing value itself. Statistical techniques like multiple imputation can address this without bias.
- Missing not at random (MNAR): The probability of missing data depends on the missing value itself. For example, students with the highest anxiety might be most likely to skip the anxiety items. This is the most problematic mechanism and requires careful analysis and transparent reporting.
Report your missing data: how many cases have missing values on each variable, what pattern the missingness takes, what mechanism you believe is operating and why, and what approach you used to address it. Listwise deletion (dropping any case with any missing value) is the default in most software but is rarely the best approach — it can reduce your sample substantially and introduces bias if data is not MCAR.
Organising Qualitative Data for Systematic Analysis
The module says to get qualitative data into a consistent format. This section explains what that means in practice and why consistency at the organisation stage makes a material difference to analysis quality.
Transcription standards
Verbatim transcription — capturing every word, including false starts, hesitations, and filler words — is the standard for most qualitative analysis. It preserves information about how something was said as well as what was said: hesitation before answering a question, laughter that changes the meaning of a statement, a participant who starts to say one thing and self-corrects.
Decide your transcription conventions before you begin and apply them consistently: Do you transcribe “um” and “uh”? How do you mark laughter, pauses, or overlapping speech? Do you use pseudonyms in the transcript or a participant code? Inconsistent transcription conventions across a dataset introduce noise into your analysis that cannot be corrected after the fact.
Consistent transcription convention example: [Laughs] = audible laughter [Pause] = pause of more than 3 seconds … = trailing off / incomplete thought [inaudible] = section too unclear to transcribe All names anonymised to codes: P1, P2, P3 etc. at time of transcription
The analytical memo: your first analysis step
An analytical memo is a short note you write to yourself after each interview or observation session — before you begin formal coding. It captures immediate impressions, patterns that struck you, questions the data raised, and connections to other interviews you have conducted. It takes fifteen minutes and is among the highest-return investments in qualitative research.
Analytical memos are not peripheral to analysis — they are the beginning of it. The patterns you notice in early memos often become your first codes. The questions you raise become directions for subsequent data collection. The connections you notice become the basis for theoretical integration. Researchers who skip memos in the interest of time typically find that their analysis takes longer, not shorter, because they have no record of early pattern recognition to build on.
File organisation that supports systematic analysis
A disorganised file structure does not just slow down analysis — it introduces error. When you cannot find the transcript you need, you may inadvertently analyse an older version of the file. When files are not clearly named, you may duplicate coding work or miss data you intended to include.
- Name files with consistent structure: Interview_P03_2024-03-15.docx — participant code, date. Never use participant names in file names.
- Keep original and working versions separate: Store original transcripts in a read-only folder. Work on copies. If a coding error corrupts a working file, you can always return to the original.
- Maintain a dataset log: A simple spreadsheet recording every data collection event: participant code, date, duration, status (raw / transcribed / coded / member-checked). At a glance, you can see what has been done and what remains.
🔱 For Law Students
Data preparation in legal research has two distinct applications depending on whether the research is doctrinal, quantitative empirical, or qualitative empirical.
Preparing doctrinal data: the case dataset
For doctrinal research, preparation means building the case dataset before beginning analysis. This requires: listing every case included, recording the basic bibliographic information for each (case name, citation, court, date, bench composition), and identifying the specific provisions, principles, or issues that are the focus of analysis.
A case analysis matrix — a spreadsheet with one row per case and columns for each doctrinal variable you are tracking — is the quantitative equivalent of the codebook for legal research. Before reading cases for analysis, decide what you will record from each one: outcome (upheld/dismissed), reasoning type (textual/purposivist/historical), citation of precedents (which cases cited), presence or absence of a dissent, and any other variables relevant to your doctrinal question. Deciding this in advance prevents the most common doctrinal analysis error — reading the first five cases and recording one set of features, then reading the next five and noticing different features, with no consistent record to compare across the full dataset.
Preparing quantitative legal data
Quantitative legal datasets — drawn from NJDG, SCC Online exports, or manually collected court records — require the same cleaning steps described above, with additional challenges specific to legal data. Case classification is inconsistent across reporters and databases: the same type of case may be classified under different subject matter categories in different sources. Outcome coding requires careful definition — what counts as a “win” for the petitioner depends on how you define win, and that definition must be recorded in the codebook before coding begins.
Sentencing data, bail data, and case duration data from Indian courts frequently contain outliers that reflect genuine variation (cases that took thirty years due to adjournments) rather than data entry errors. These must be handled analytically — through winsorisation, log transformation, or stratified analysis — rather than simply deleted, and the approach must be documented and justified.
References
- Field, A. (2024). Discovering Statistics Using IBM SPSS Statistics (6th ed.). Sage.
- Tabachnick, B. G., & Fidell, L. S. (2022). Using Multivariate Statistics (8th ed.). Pearson.
- Saldaña, J. (2021). The Coding Manual for Qualitative Researchers (4th ed.). Sage.
- Miles, M. B., Huberman, A. M., & Saldaña, J. (2024). Qualitative Data Analysis: A Methods Sourcebook (5th ed.). Sage.
- van Buuren, S. (2018). Flexible Imputation of Missing Data (2nd ed.). CRC Press. (Available free online: stefvanbuuren.name/fimd)
- National Judicial Data Grid (NJDG) — India court statistics. njdg.gov.in
Next: Cluster Post 2 — Descriptive Statistics: What to Report and How to Read Them

The Complete Guide to Research Paper Structure: IMRAD Format, Thesis Organization & Academic Writing (2026)
From Concept to Submission: A Complete Guide to Research Paper and Thesis Writing Module 1:…
The IMRAD Framework: Why It Exists, How It Really Works, and Where It Breaks Down
Cluster Post 1 | Module 1: Understanding the Structure of Research Papers and Theses From…

How to Write a Research Introduction That Reviewers Cannot Ignore
Cluster Post 2 | Module 1: Understanding the Structure of Research Papers and Theses From…

How to Write a Methods Section That Reviewers Will Trust
Cluster Post 3 | Module 1: Understanding the Structure of Research Papers and Theses From…
The Results Section: How to Present Findings Without Letting Interpretation Slip In
Cluster Post 4 | Module 1: Understanding the Structure of Research Papers and Theses From…

The Discussion Section: How to Turn Findings Into Knowledge
Cluster Post 5 | Module 1: Understanding the Structure of Research Papers and Theses From…
Complete Thesis Structure: A Chapter-by-Chapter Guide
Cluster Post 6 | Module 1: Understanding the Structure of Research Papers and Theses From…

10 Structural Mistakes That Get Research Papers Rejected — And How to Fix Every One
Cluster Post 7 | Module 1: Understanding the Structure of Research Papers and Theses From…

The Academic Writing Process: Complete Guide from First Draft to Submission (2026)
From Concept to Submission: A Complete Guide to Research Paper and Thesis Writing Module 2,…

How to Start Writing — and Keep Going
Cluster Post 1 | Module 2: The Academic Writing Process From Concept to Submission Series …

How to Write Clear Engaging Academic Prose
Cluster Post 2 | Module 2: The Academic Writing Process From Concept to Submission Series …
The Revision Process: How to Turn a Draft Into a Submission
Cluster Post 3 | Module 2: The Academic Writing Process From Concept to Submission Series …

Citation Styles Explained: APA, MLA, Chicago, IEEE, and Bluebook
Cluster Post 4 | Module 2: The Academic Writing Process From Concept to Submission Series …
Reference Management: Zotero and Mendeley from Setup to Submission
Cluster Post 5 | Module 2: The Academic Writing Process From Concept to Submission Series …
Research Methodologies: Complete Guide to Quantitative, Qualitative, Mixed Methods & Legal Research (2026)
Why Methodology Determines Research Quality Here’s what thesis examiners focus on first: your methodology section…

Research Paradigms: Why Your Philosophical Stance Shapes Everything
Cluster Post 1 | Module 3: Research Methodologies From Concept to Submission Series | 2026 ←…
Quantitative Research Design: From Hypothesis to Valid Results
Cluster Post 2 | Module 3: Research Methodologies From Concept to Submission Series | 2026…
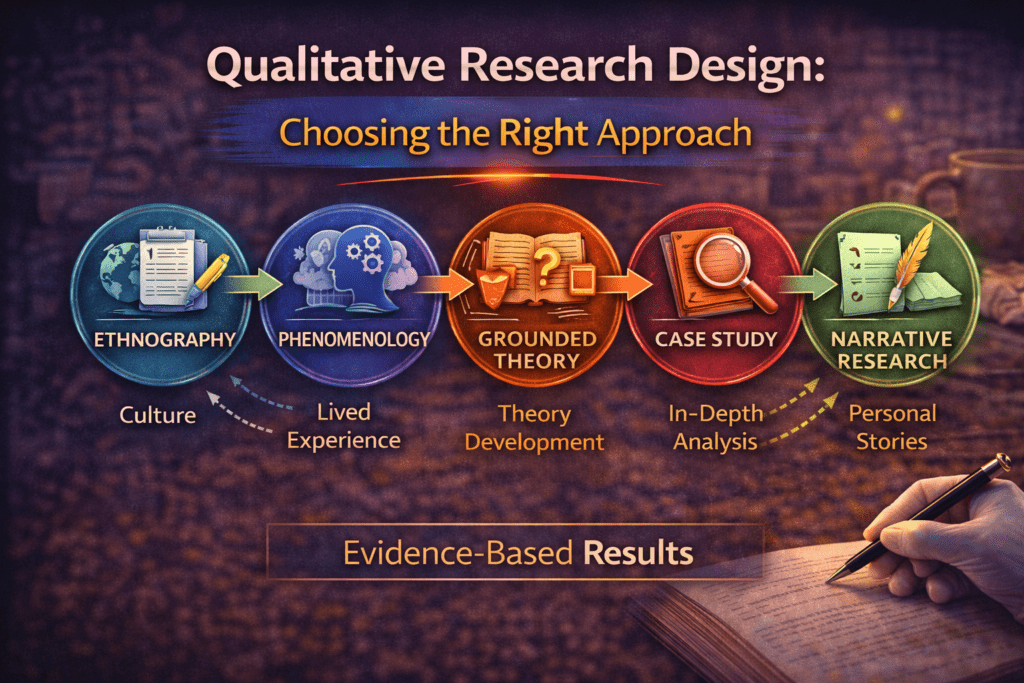
Qualitative Research Design: Choosing the Right Approach
Cluster Post 3 | Module 3: Research Methodologies From Concept to Submission Series | 2026…
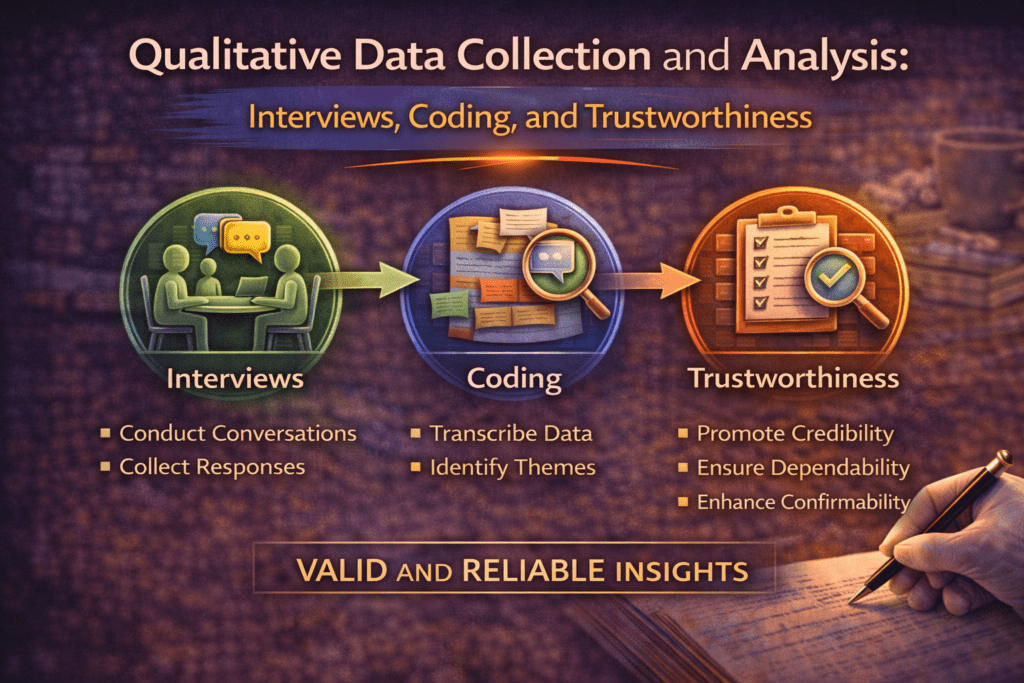
Qualitative Data Collection and Analysis: Interviews, Coding, and Trustworthiness
Cluster Post 4 | Module 3: Research Methodologies From Concept to Submission Series | 2026…
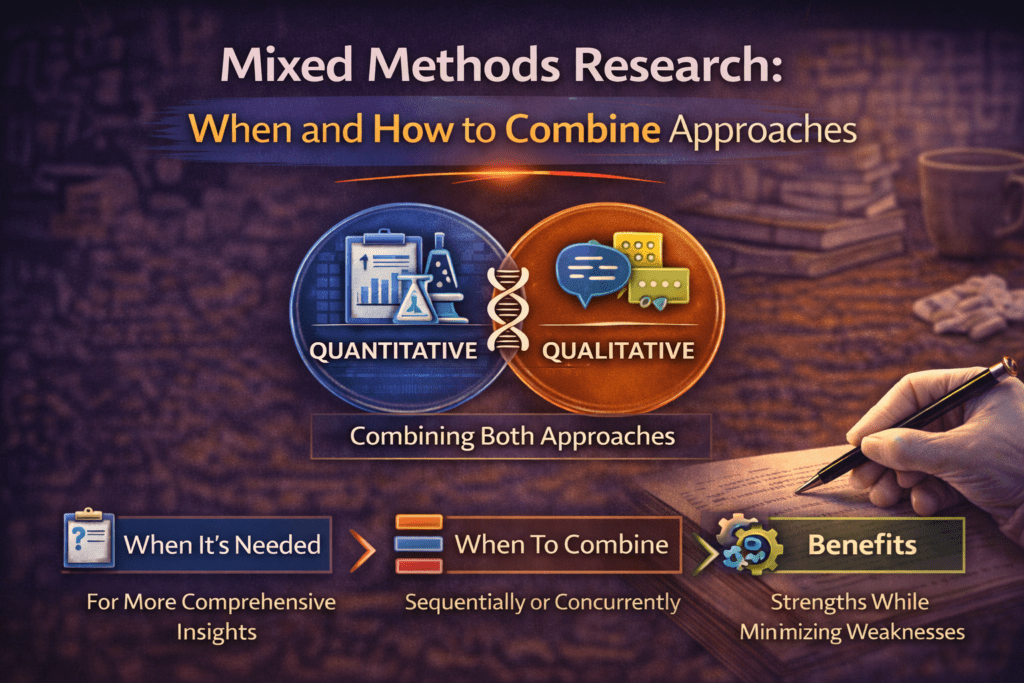
Mixed Methods Research: When and How to Combine Approaches
Cluster Post 5 | Module 3: Research Methodologies From Concept to Submission Series | 2026…
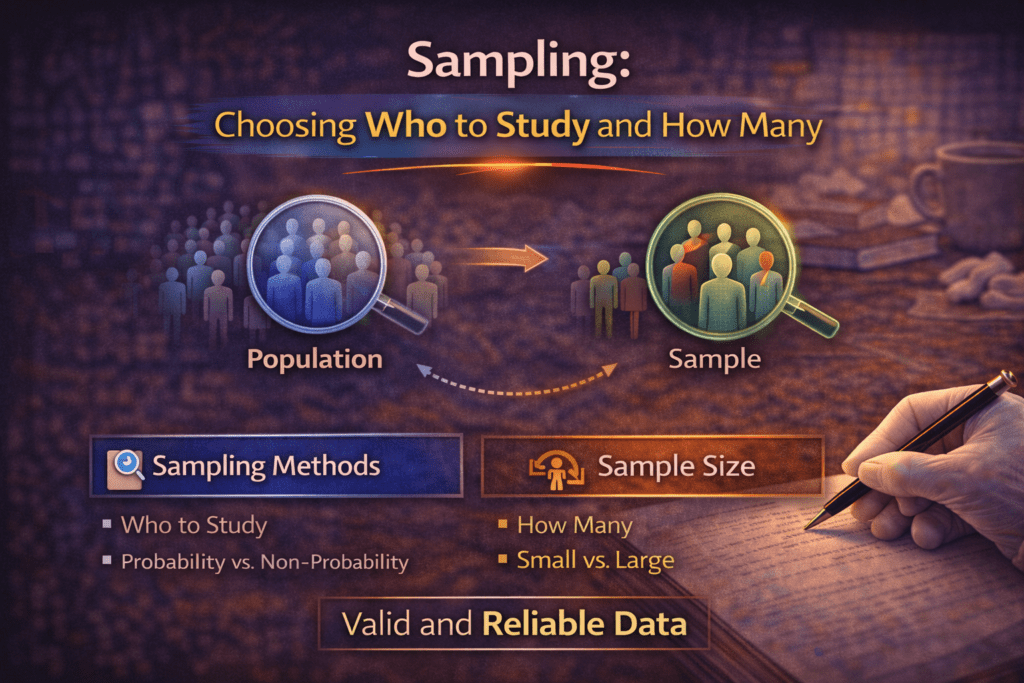
Sampling: Choosing Who to Study and How Many
Cluster Post 6 | Module 3: Research Methodologies From Concept to Submission Series | 2026…
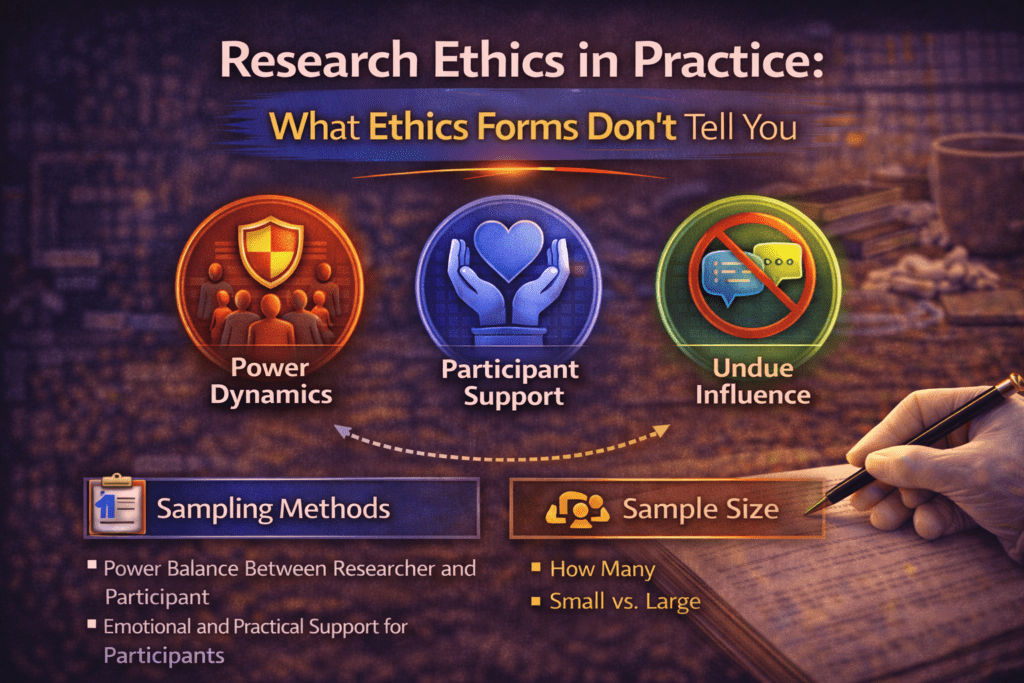
Research Ethics in Practice: What Ethics Forms Don’t Tell You
Cluster Post 7 | Module 3: Research Methodologies From Concept to Submission Series | 2026…
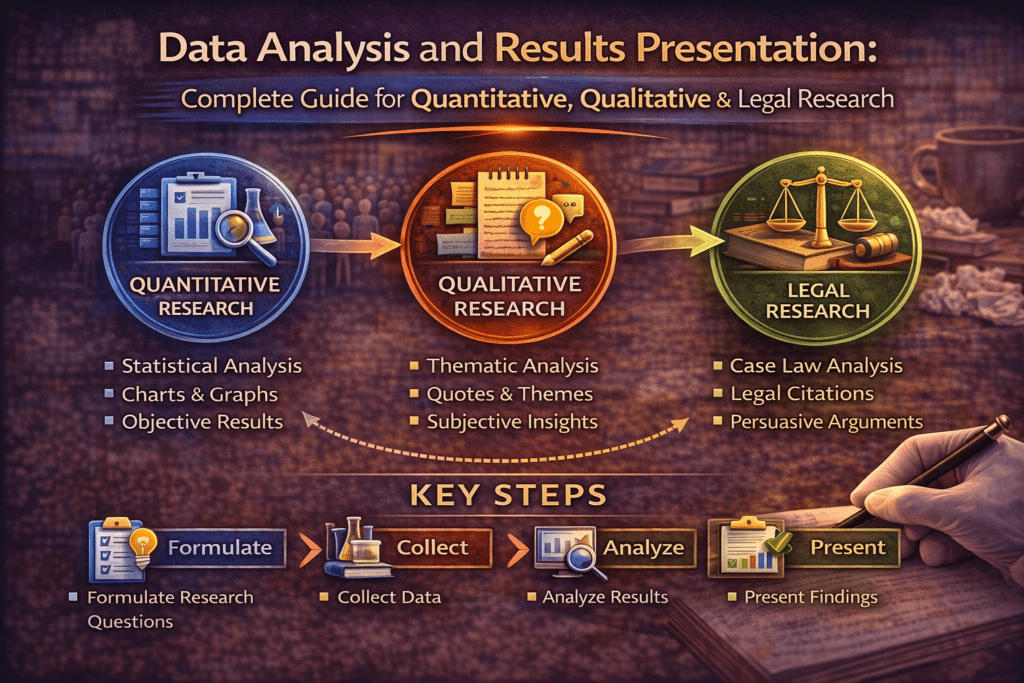
Data Analysis and Results Presentation: Complete Guide for Quantitative, Qualitative & Legal Research (2026)
Data Analysis and Results Presentation: Why Data Analysis Determines Research Credibility Here’s what separates published…
Preparing Your Data: The Work That Determines Analysis Quality
Cluster Post 1 | Module 4: Data Analysis and Presenting Results From Concept to Submission…
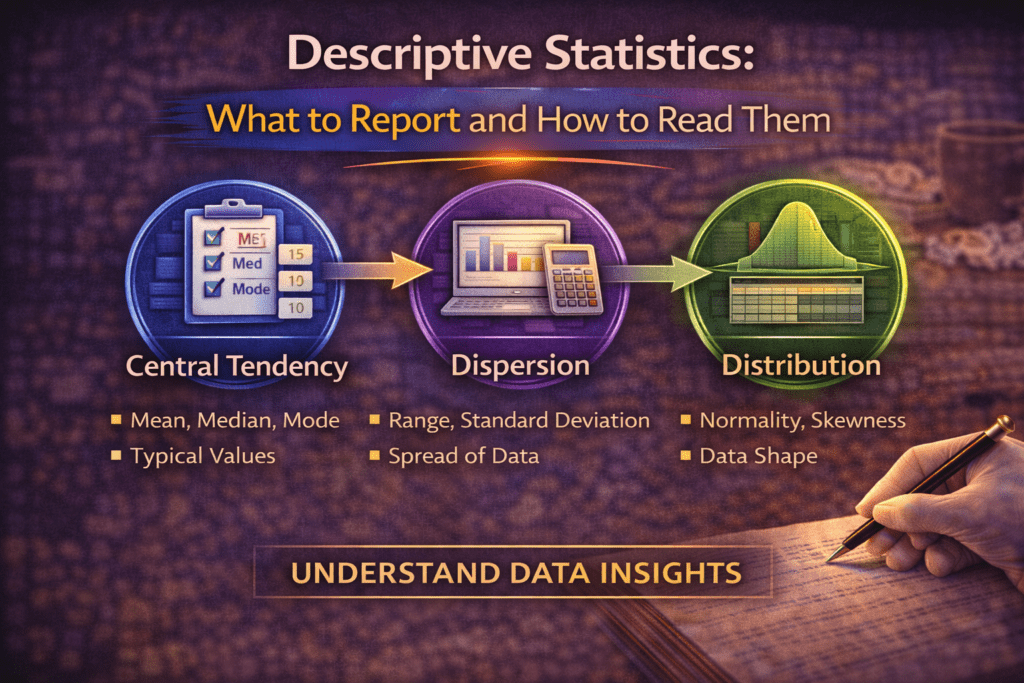
Descriptive Statistics: What to Report and How to Read Them
Cluster Post 2 | Module 4: Data Analysis and Presenting Results From Concept to Submission…
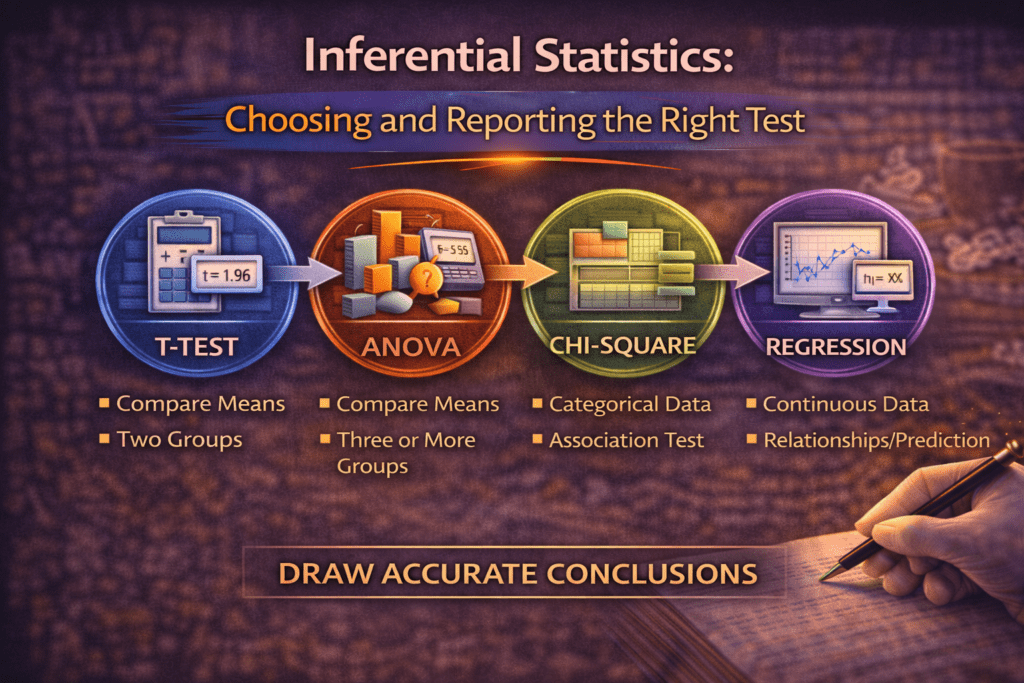
Inferential Statistics: Choosing and Reporting the Right Test
Cluster Post 3 | Module 4: Data Analysis and Presenting Results From Concept to Submission…
Statistical Assumptions: The Checks Most Researchers Skip
Cluster Post 4 | Module 4: Data Analysis and Presenting Results From Concept to Submission…
Presenting Qualitative Findings: Quotes, Themes, and the Balance Between Showing and Telling
Cluster Post 5 | Module 4: Data Analysis and Presenting Results From Concept to Submission…
Writing the Results Section: Separating Findings from Interpretation
Cluster Post 6 | Module 4: Data Analysis and Presenting Results From Concept to Submission…

Organization and Academic Tone: Complete Guide to Professional Scholarly Writing (2026)
Why Organization and Academic Tone Matter More Than You Think Here’s what thesis examiners notice…