Last Updated: April 27, 2026
AI Data Analysis Tools
AI Research Revolution 2026: Complete PhD Workflow Guide
A simple guide — no coding, no confusion. Just tools that make data analysis easy for every researcher.
- No Coding Needed
- Mostly Free
- Saves Weeks of Work
- Perfect for Beginners
“Data analysis is no longer about coding skills —
it is about asking the right questions and letting AI do the heavy work.”
If the words “data analysis” make you nervous — you are not alone. Many PhD students feel the same way. They have worked hard to collect their data, but when it is time to actually analyse it, they feel stuck. SPSS looks complicated. R requires coding. And nobody has time to learn a programming language in the middle of a PhD.
Here is the good news: the best AI statistical analysis tools PhD 2026 can do the hard work for you. You do not need to write a single line of code. You just ask a question in simple English, and the tool gives you the answer — with charts, numbers, and a clear explanation.
In this guide, I will walk you through 7 tools that make data analysis simple, fast, and even a little enjoyable. Let’s get started.
This guide is for you if… You are a PhD student, research scholar, or academic writer who finds data analysis confusing or time-consuming. No technical background is needed to understand this guide — or to use these tools.
Why Data Analysis Feels So Hard for PhD Students
Let’s be honest about the three main reasons PhD students struggle with data analysis:
- The tools are built for experts, not researchers. Software like SPSS, R, and Stata are powerful — but they were designed for professional statisticians. Learning to use them properly takes months. Most PhD students just do not have that time.
- Coding is a big barrier. Python and R can do amazing things, but they require you to write and learn code. If your PhD is in education, social work, or nursing — why should you need to be a programmer too?
- It is very time-consuming. Running tests manually, making charts one by one, checking every assumption by hand — it can take weeks. And that is weeks you could spend on the parts of your PhD that actually matter.
The Real Problem Traditional tools were made for statistics experts. Researchers need analysis results — not a course in programming. AI tools fix this gap by letting you describe what you want and getting results instantly.
How AI is Making Data Analysis Simple
AI data analysis tools work in a very different way from traditional software. Here is what makes them so much easier to use:
- You talk to them like a person. Instead of learning special commands or code, you just type what you want in normal language. “Show me a bar chart of this data.” “Is there a link between these two numbers?” The AI understands you and does it.
- They explain the results too. Most AI tools do not just give you a table of numbers — they tell you what those numbers mean. You get the result and the explanation, in simple english.
- They save you hours — sometimes weeks. Tasks that used to take days can be done in minutes. That is not an exaggeration. You will feel the difference the very first time you use one of these tools.
Important Reminder AI tools help you run the analysis and understand the numbers. But you are still the expert on your research. Always read the results, check they make sense, and use your own judgment when writing about what they mean.
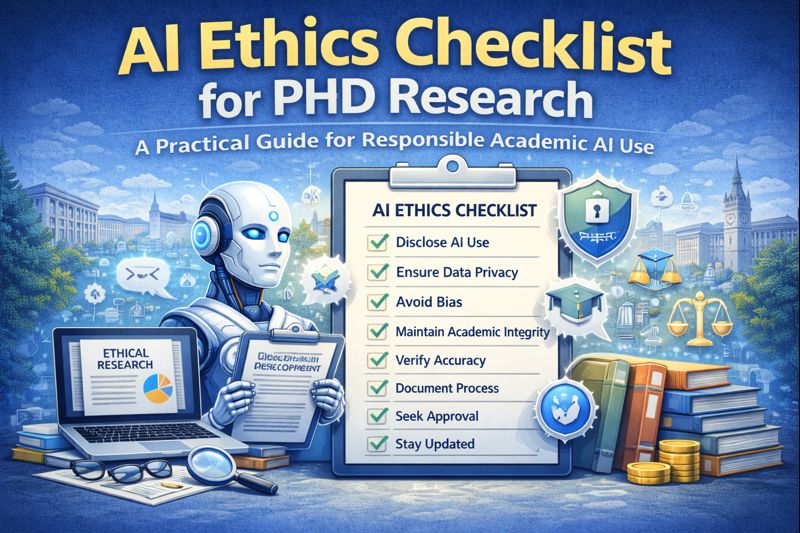
AI Ethics Checklist for PhD Research: A Practical Guide
7 AI Data Analysis Tools Every PhD Student Should Know
Julius AI
julius.ai — Best for: beginners, survey data, charts – Free + Paid
| What Is It? Julius AI is like having a data analyst friend. You upload your spreadsheet, type your question, and it gives you the answer — with a chart and an explanation. | What Can It Do? Find connections (correlations) between variables Create bar charts, pie charts, scatter plots Run statistical tests in seconds Explain what the results mean in simple words |
| How Does It Help PhD Students? If data analysis feels confusing, Julius AI makes it much easier. You do not need SPSS, you do not need R. Just upload your file, type your question, and get your answer. | Good Points Zero coding — anyone can use it Results in under 30 seconds Makes professional-looking charts Plain English explanations included |
Example – You upload your survey results file. You type: “Is there a relationship between study hours and exam scores?” Julius shows you a scatter chart and says: “Yes — students who study more tend to score higher (r = 0.72, strong positive correlation).”
The free version has a limited number of questions per month. Use it for focused analysis sessions. Very large files (50,000+ rows) may be slow on the free plan.

ChatGPT — Advanced Data Analysis
chat.openai.com — Best for: complex analysis, any dataset – Paid (Plus)
| What Is It? ChatGPT Plus has a special “Advanced Data Analysis” feature. You upload your data file, describe what you want, and ChatGPT writes and runs Python code for you — you never see the code, just the results. | What Can It Do? Run almost any statistical test you need Clean messy or incomplete datasets Create detailed charts and graphs Explain results step by step |
| How Does It Help PhD Students? This tool lets you do advanced analysis that used to require Python expertise — without writing a single line of code. Just describe what you want and it delivers. | Good Points Most powerful analysis tool available Works with any type of data file You can ask follow-up questions on results Explains every step clearly |
Example – You upload your dissertation data and type: “Run a regression to predict student performance from three variables — attendance, hours studied, and previous grades. Show me the results table and explain what it means.” ChatGPT does exactly that.
Needs a ChatGPT Plus subscription (paid monthly). Do not upload data with participant names or personal details — always use anonymised data for privacy and ethics compliance.
Tableau Public
public.tableau.com — Best for: charts, maps, visual data – 100% Fre
| What Is It? Tableau Public is a free drag-and-drop tool for making beautiful charts and visual dashboards from your data. No coding at all — you just drag columns to where you want them and it builds the chart for you. | What Can It Do? Create bar charts, line graphs, maps, heatmaps Suggest the best chart type for your data Build interactive visual dashboards Export high-quality images for thesis or journal |
| How Does It Help PhD Students? Good charts make your findings clear and convincing. Tableau helps you create the kind of professional visualisations that PhD examiners and journal reviewers expect — in just a few minutes. | Good Points Completely free — no subscription needed Drag and drop — no coding at all Professional quality results Great for thesis figures and conference posters |
Example – You connect your survey Excel file to Tableau. Drag “Country” to the map and “Average Score” to Colour. In 2 minutes you have a professional colour-coded world map showing your survey results by country.
In the free version, all your charts become public on the Tableau website. If your data is private or not yet published, use the paid desktop version or wait until after publication.

ATLAS.ti
atlasti.com — Best for: interviews, qualitative research – Free (limited) + Paid
| What Is It? ATLAS.ti is the go-to tool for qualitative researchers. If you have interview recordings, focus group notes, or open survey answers to analyse, this tool uses AI to help you find themes and patterns automatically. | What Can It Do? Read your interview text and suggest themes (codes) Show you how themes connect to each other visually Work with text, audio, video, and images Run sentiment analysis on responses |
| How Does It Help PhD Students? Coding 20 interview transcripts by hand used to take weeks. ATLAS.ti’s AI suggests codes in minutes. You review them, keep what makes sense, and delete what doesn’t. You stay in charge — the AI just does the first pass. | Good Points Specifically made for qualitative PhD research Trusted and accepted by most universities Handles text, audio, video, and images Creates visual maps of your themes |
Example – You import 15 interview transcripts. Click “AI Coding.” ATLAS.ti reads all of them and suggests themes like “Student anxiety,” “Teacher support,” and “Motivation barriers.” You review each one and decide what to keep — saving you 2–3 weeks of manual work.
The free version only allows 10 documents and 100 quotes — good for a small pilot study but not a full PhD qualitative analysis. A paid plan is likely needed for a full dissertation.
- Run almost any statistical test you need
- Clean messy or incomplete datasets
- Create detailed charts and graphs
- Explain results step by step

Otter.ai
otter.ai — Best for: transcribing interviews automatically – Free + Paid
| What Is It? Otter.ai listens to your audio recordings and turns them into written text automatically. It even labels who is speaking. What used to take 5–6 hours of typing now takes about 5 minutes. | What Can It Do? Transcribe audio or video interviews Label each speaker separately Create a searchable text document Generate an AI summary of the conversation |
| How Does It Help PhD Students? If you are doing qualitative research with interviews, Otter.ai saves you enormous amounts of time. You get your transcript ready in minutes — and then you can import it straight into ATLAS.ti for analysis. | Good Points Very fast — minutes instead of hours Works on your phone during live interviews Transcripts are searchable and downloadable Connects well with ATLAS.ti workflow |
Example – You record a 45-minute interview with a participant. Upload the audio to Otter.ai. In about 5 minutes, you have a full written transcript with speaker labels (“Interviewer:” and “Participant:”) ready to download and analyse.
Free plan gives you 300 minutes of transcription per month. Accuracy can be lower with strong accents, background noise, or very technical vocabulary — always read through and correct the transcript before using it in your research.

NotebookLM (by Google)
notebooklm.google — Best for: understanding your own data and findings – 100% Free
| What Is It? NotebookLM is a free AI tool from Google. You upload your own documents — reports, analysis results, research notes — and then chat with them. The AI only uses your files to answer, so there are no made-up facts. | What Can It Do? Read multiple documents at the same time Answer questions based only on your uploaded files Find patterns across different data sources Create summaries and outlines from your results |
| How Does It Help PhD Students? Once you have run your analysis, NotebookLM helps you make sense of the results. Upload your charts, data summaries, and reports — then ask “What are the most important findings here?” It answers using only your data. | Good Points Completely free — no limits on daily use Only uses your uploaded documents — no hallucinations Every answer shows which document it came from Great for writing your findings chapter |
Example – You upload your Julius AI output, your Tableau charts description, and your interview summary. You ask: “What three findings appear consistently across all my data sources?” NotebookLM gives you a clear, cited answer — using only your own files.
Works best with clear, text-based PDF files. Scanned images or handwritten notes may not work well. Not suitable for very large raw data files.
Flourish
flourish.studio — Best for: beautiful charts and presentations – Free (Public)
| What Is It? Flourish is a free online tool for making stunning, colourful data visualisations. It has over 100 ready-made templates — you pick one, paste in your data, and your chart is ready in minutes. | What Can It Do? 100+ beautiful chart and map templates Animated charts for presentations Download as image or embed anywhere No design skills needed at all |
| How Does It Help PhD Students? When you want your data to look really impressive — for a conference, a journal submission, or a thesis chapter — Flourish creates the kind of visuals that make people stop and pay attention. | Good Points The most visually impressive free tool on this list No design experience needed Perfect for conference posters and presentations Easy to export for thesis or journal use |
Example – You have data showing how student performance changed over 4 years across 5 different schools. You paste it into Flourish’s “Animated Bar Chart Race” template. In 10 minutes you have a stunning animated chart ready for your conference presentation.
Free charts are visible to the public on Flourish’s website. If your data is not yet published or contains sensitive information, wait until publication or use the paid private plan.
5 Simple Steps to Analyse Your Data Using AI
Here is exactly what to do — from start to finish — in the right order.
- Clean and Prepare Your Data First
Before you upload anything to an AI tool, make sure your data is neat. Remove duplicate rows. Fill in any missing information. Make sure each column has a clear, simple heading. Save it as an Excel or CSV file. This step is manual — but it takes only 20–30 minutes and makes everything else much faster and more accurate. Use: Excel or Google Sheets
2. Upload Your File and Describe What You Need
Open Julius AI or ChatGPT Advanced Data Analysis. Upload your clean file. Start with a simple question: “Can you give me a basic summary of this data?” This helps the AI understand your dataset before you ask for deeper analysis. Use: Julius AI or ChatGPT ADA
3. Run Your Analysis
Now ask for what you actually need. Be specific. Instead of “analyse my data,” say: “Is there a significant difference between Group A and Group B scores?” or “Show me the top 5 factors that predict the outcome variable.” Specific questions get clear, useful answers. Use: Julius AI or ChatGPT ADA
4. Create Your Charts and Visuals
Take your results and make them look great. Use Tableau Public or Flourish for clean, professional charts. Good visuals make your findings instantly clear to any reader — including your thesis examiner and journal reviewers. This step takes 10–20 minutes but makes a huge difference to how your work is received. Use: Tableau Public or Flourish
5. Interpret and Write Up Your Findings
This is the most important step — and it is yours alone. Upload your analysis outputs to NotebookLM and ask it to identify patterns across your data. Then use those insights as a starting point to write your own findings chapter. Remember: AI gives you the numbers and patterns. You give them meaning by connecting them to your research question. Use: NotebookLM + Paperpal for writing polish
AI Tools vs Traditional Tools — How Do They Compare?

| What We Are Comparing | Traditional (SPSS / R) | AI Tools (Julius / ChatGPT) |
|---|---|---|
| How hard is it to learn? | Takes months | Ready to use in an hour |
| Do I need coding? | Yes — complex code needed | No — plain English only |
| How fast is it? | Hours or days | Minutes |
| Does it explain results? | Numbers only — you interpret | Yes — plain English explanation included |
| Quality of charts? | Good, but slow to customise | Publication-quality in minutes |
| Cost? | Often very expensive licences | Free or low-cost plans available |
| Best for complex specialist analysis? | Yes — very powerful for experts | Most PhD needs are covered, but some advanced methods may still need traditional tools |
For the vast majority of PhD students — surveys, interviews, standard statistical tests, and data visualisation — AI tools are completely sufficient. You only need traditional software if you are doing highly specialised statistical work that goes beyond typical thesis requirements.
Which Tool Should You Start With?
Not sure where to begin? Here is a simple guide based on what you need:
| Complete Beginner Julius AI The simplest starting point. Upload your file, type your question, get your answer. Perfect for first-time users. | Doing Interviews / Surveys Otter.ai + ATLAS.ti Transcribe interviews automatically with Otter, then code themes in ATLAS.ti. A complete qualitative research pipeline. | Need Beautiful Charts Flourish + Tableau Flourish for stunning presentation visuals. Tableau for detailed, interactive dashboards. Both free for public research. | Need Advanced Analysis ChatGPT ADA The most powerful option. Handles regression, clustering, hypothesis testing — all without any coding from you. | Want Everything Free Julius + NotebookLM + Flourish Three genuinely useful free tools that cover analysis, interpretation, and visualisation with zero cost. |
Common Mistakes to Avoid
- Uploading messy data. AI tools work much better when your data is clean and organised. Spend 20–30 minutes tidying up your spreadsheet before uploading. It saves you hours of confusing results later.
- Believing every result without checking it. AI tools are good but not perfect. Always read through the results and ask yourself: “Does this make sense for my research?” If something looks unusual, double-check it.
- Copying AI explanations directly into your thesis. The AI explanation is a helpful starting point — not finished writing. Rewrite it in your own words, connecting the numbers to your specific research question and context.
- Uploading personal participant data. Never upload data that contains participant names, email addresses, or other identifying information to any AI tool. Always use anonymised data. This is a research ethics requirement.
- Not telling your institution which tools you used. Most universities in 2026 now ask you to mention AI tools in your methodology section. Write a brief sentence like: “Data visualisation was supported by Tableau Public. All outputs were reviewed and interpreted by the researcher.” This protects you.
My Recommended Toolkit for PhD Data Analysis
If I had to recommend just the right combination of tools for a PhD student handling their data analysis, this would be it:
The Complete PhD Data Analysis Toolkit
| For numbers and statistics: Julius AI — upload your data, ask questions, get instant results. For interviews and qualitative data: Otter.ai (transcription) → ATLAS.ti (theme coding). For charts and visuals: Flourish for presentations and posters; Tableau for detailed dashboards. For understanding your findings: NotebookLM — upload your analysis outputs and ask questions. For writing your findings chapter: Paperpal — polishes your academic language before submission. Total cost at free tier: £0 — all of these have genuinely useful free plans. |
15 Best Free AI Tools Every PhD Student Needs in 2026
Frequently Asked Questions
Q. Which AI tool is best for data analysis for PhD students?
Julius AI is the best starting point — it is free, requires no coding, and explains results in plain English. For more advanced statistical analysis, ChatGPT Advanced Data Analysis (requires a paid plan) is the most powerful option. For qualitative data like interviews, ATLAS.ti is the best choice available.
Q. Can AI tools replace traditional software like SPSS or R?
For most PhD research — surveys, interviews, standard tests, and charts — yes, AI tools are now good enough. You only need traditional software if you are doing very advanced, specialist statistical analysis. Most PhD students will never need that level. Start with AI tools and only add traditional software if you hit a specific gap.
Q. Do I need to know coding to use these AI tools?
No — not at all. Julius AI, Tableau Public, Flourish, ATLAS.ti, NotebookLM, and Otter.ai all work without any coding. ChatGPT Advanced Data Analysis writes the code for you invisibly — you only type in plain English. You can analyse your entire PhD dataset without writing a single line of code.
Is it allowed to use AI tools for PhD data analysis?
Yes — most universities allow it, as long as you are transparent. Mention in your methodology section which tools you used and what tasks they helped with. Always verify AI outputs yourself. Never upload participant data with names or identifying details. Check your university’s specific AI use policy before you start.
AI Ethics and Future: Complete Guide to Responsible AI in 2026
About Author
Dr. Rekha Khandelwal PhD Research Mentor · Data Analysis Advisor · AI Content Strategist
Dr. Rekha Khandelwal is helping PhD scholars with the parts of research that nobody prepares you for — including the data analysis stage that most students find overwhelming.
- Academic Writing
- AI in Business & Marketing
- AI in Content Creation
- AI in Research
- AI in Research & Education
- AI In SEO
- AI Regulatory Framework
- AI Tools & Review
- Content Marketing & Strategy
- Creative Writing & Storytelling
- Finance
- Income Tax
- Indian Laws
- Legal Drafting & Pleading
- Motor Vehicles Act
- Mutual Funds
- Trending
- Writing & Content Creation
15 Best Free AI Tools for PhD Students 2026 Finding the best free AI tools PhD students 2026 can actually use — without spending a…
AI Data Analysis Tools AI Research Revolution 2026: Complete PhD Workflow Guide A simple guide — no coding, no confusion. Just tools that make data…
AI Ethics and Future Why AI Ethics Matters More Than Ever Think about the last time you applied for a loan, searched for a job…

AI Ethics Checklist for PhD Research 10-Point Compliance Checklist 2026 Everything you need to use AI responsibly in your thesis — with a ready-to-use disclosure…
Think about a Class 10 student in Jaipur. It is 10 pm. She is stuck on a maths problem. Her teacher is not available. The…

AI Research Revolution 2026 The complete AI PhD research workflow 2026 is changing how researchers like you approach everything — from finding a research gap…

What Is the EU AI Act? (In Simple) Imagine you build a robot that helps doctors diagnose diseases. Or you create an AI tool that…
Literature Review Using AI Tools: Step-by-Step Guide for Researchers 2026 A complete AI literature review workflow — from your first research question to a polished,…